

In the web client
Select a tool on the Tools screen and choose Load test, beside Execute Tool. Each call sends the arguments currently in the tool’s form, so fill those in first. Placeholders such as{{seq}} in a value are filled in per call (see Varying the arguments).
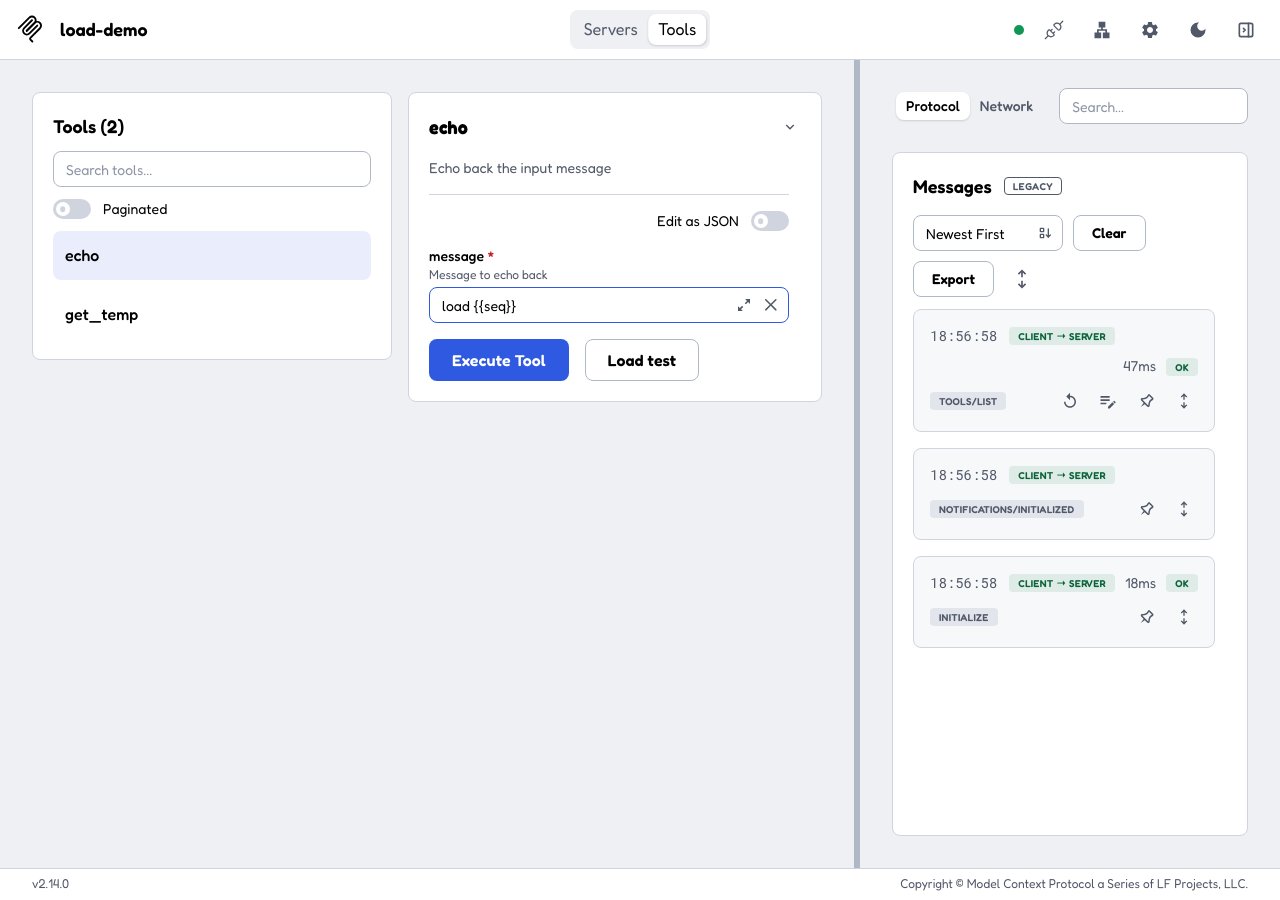
The Load test button beside Execute Tool. This form's message, load {{seq}}, gives each call a distinct value.
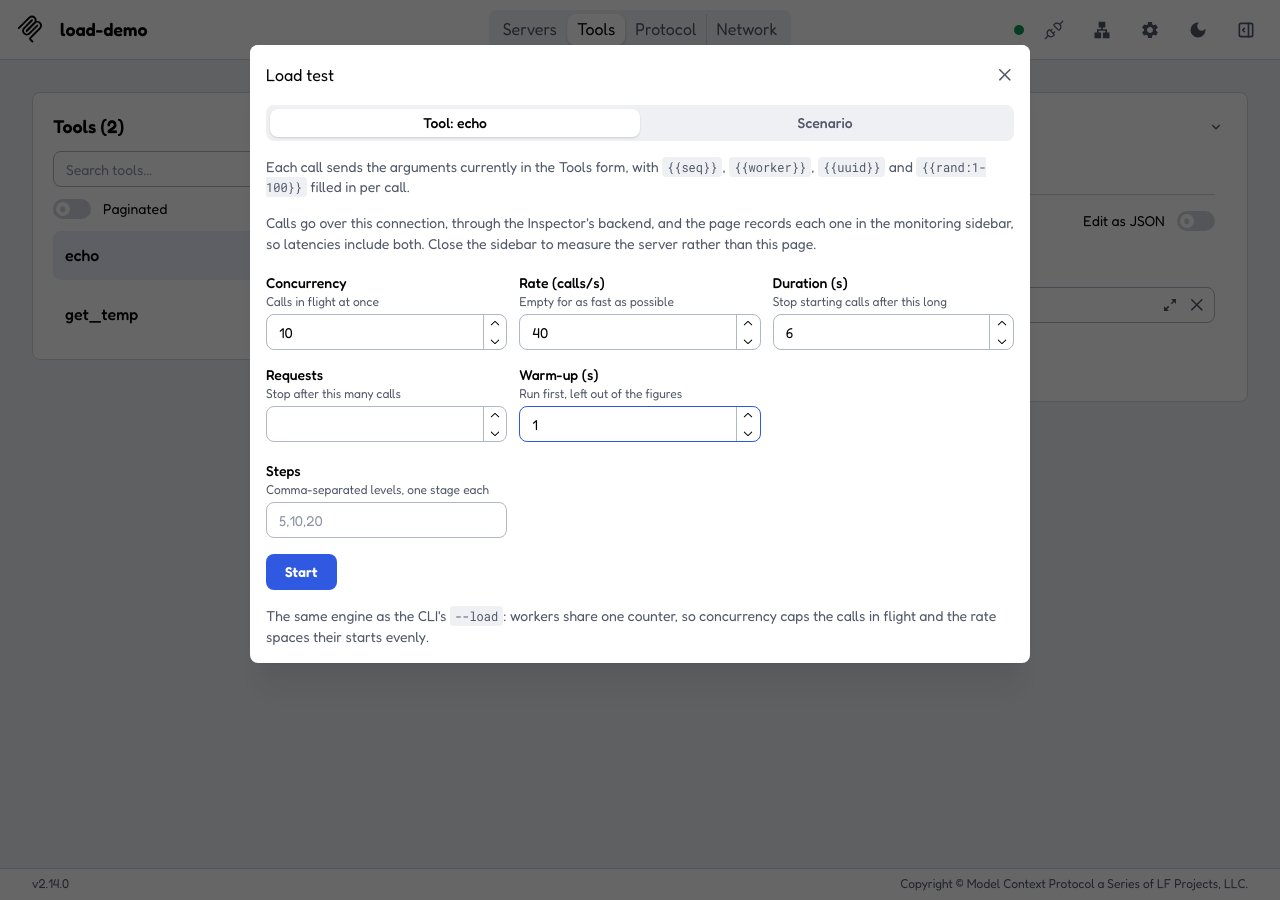
The form, set for 10 calls in flight at 40 calls per second for 6 seconds, after a 1-second warm-up.
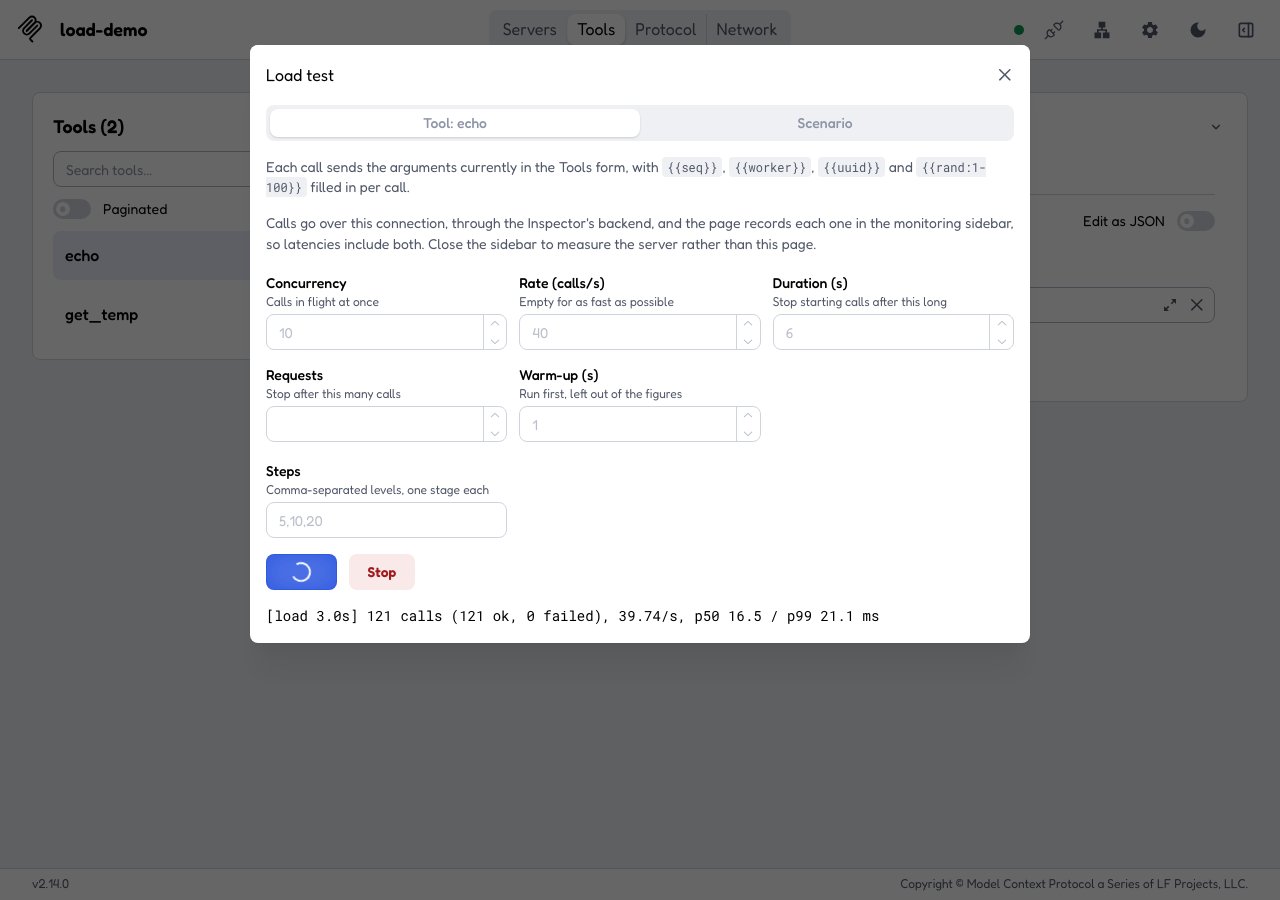
A run in progress.
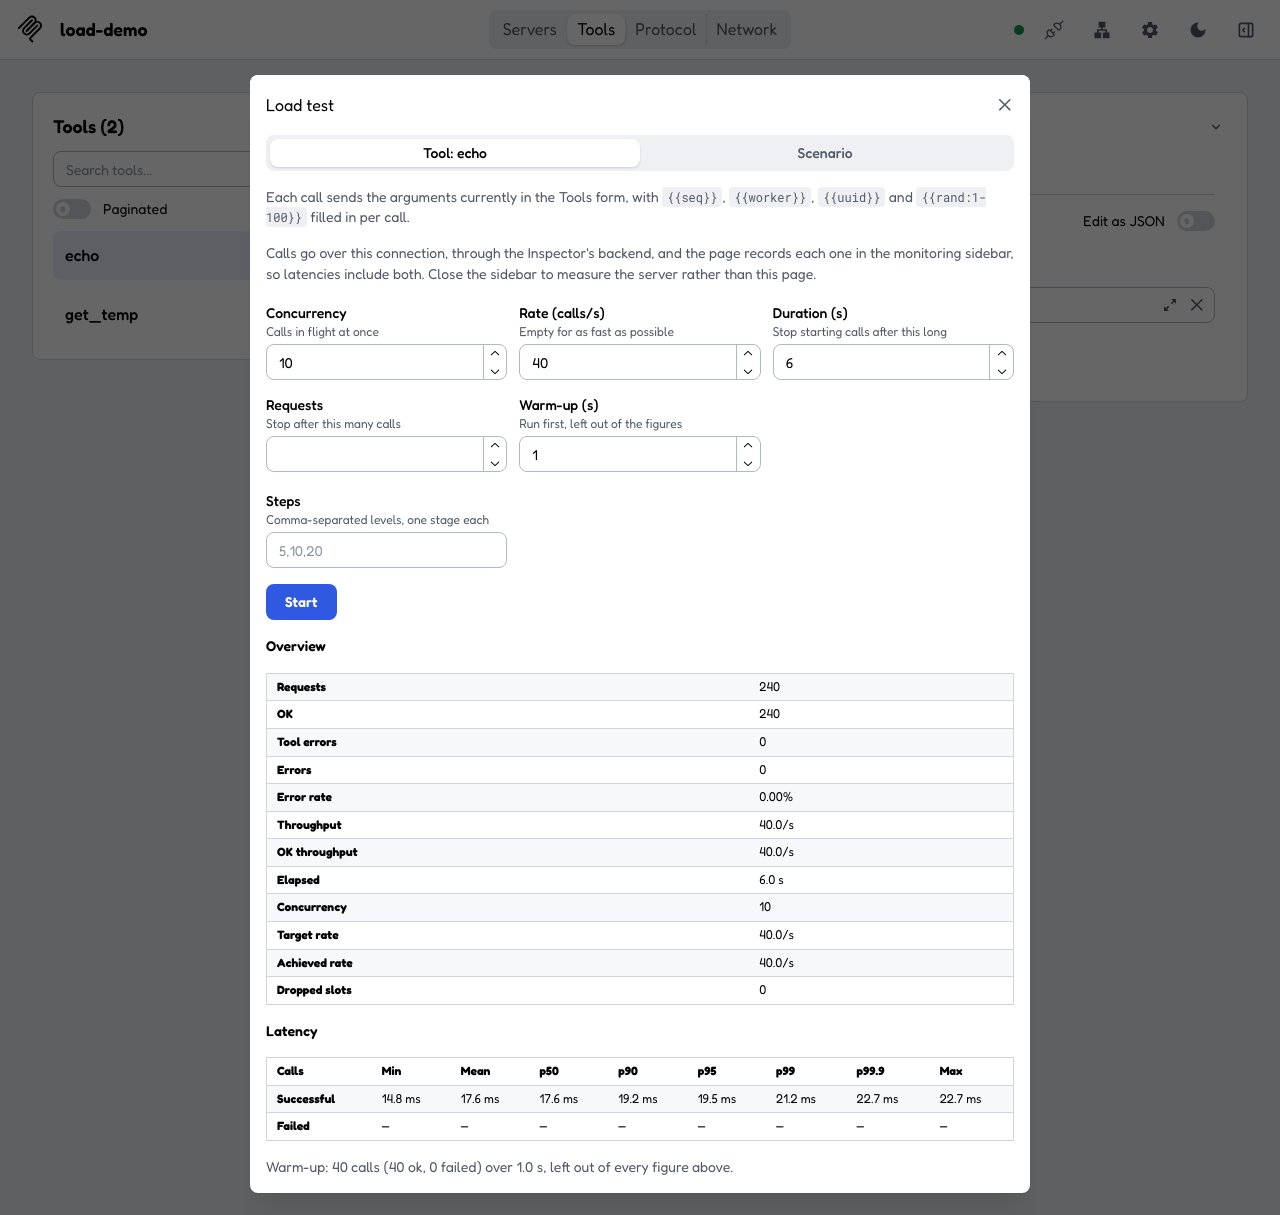
The summary of that run: every call succeeded, and the target rate of 40 calls per second was met with no dropped slots.
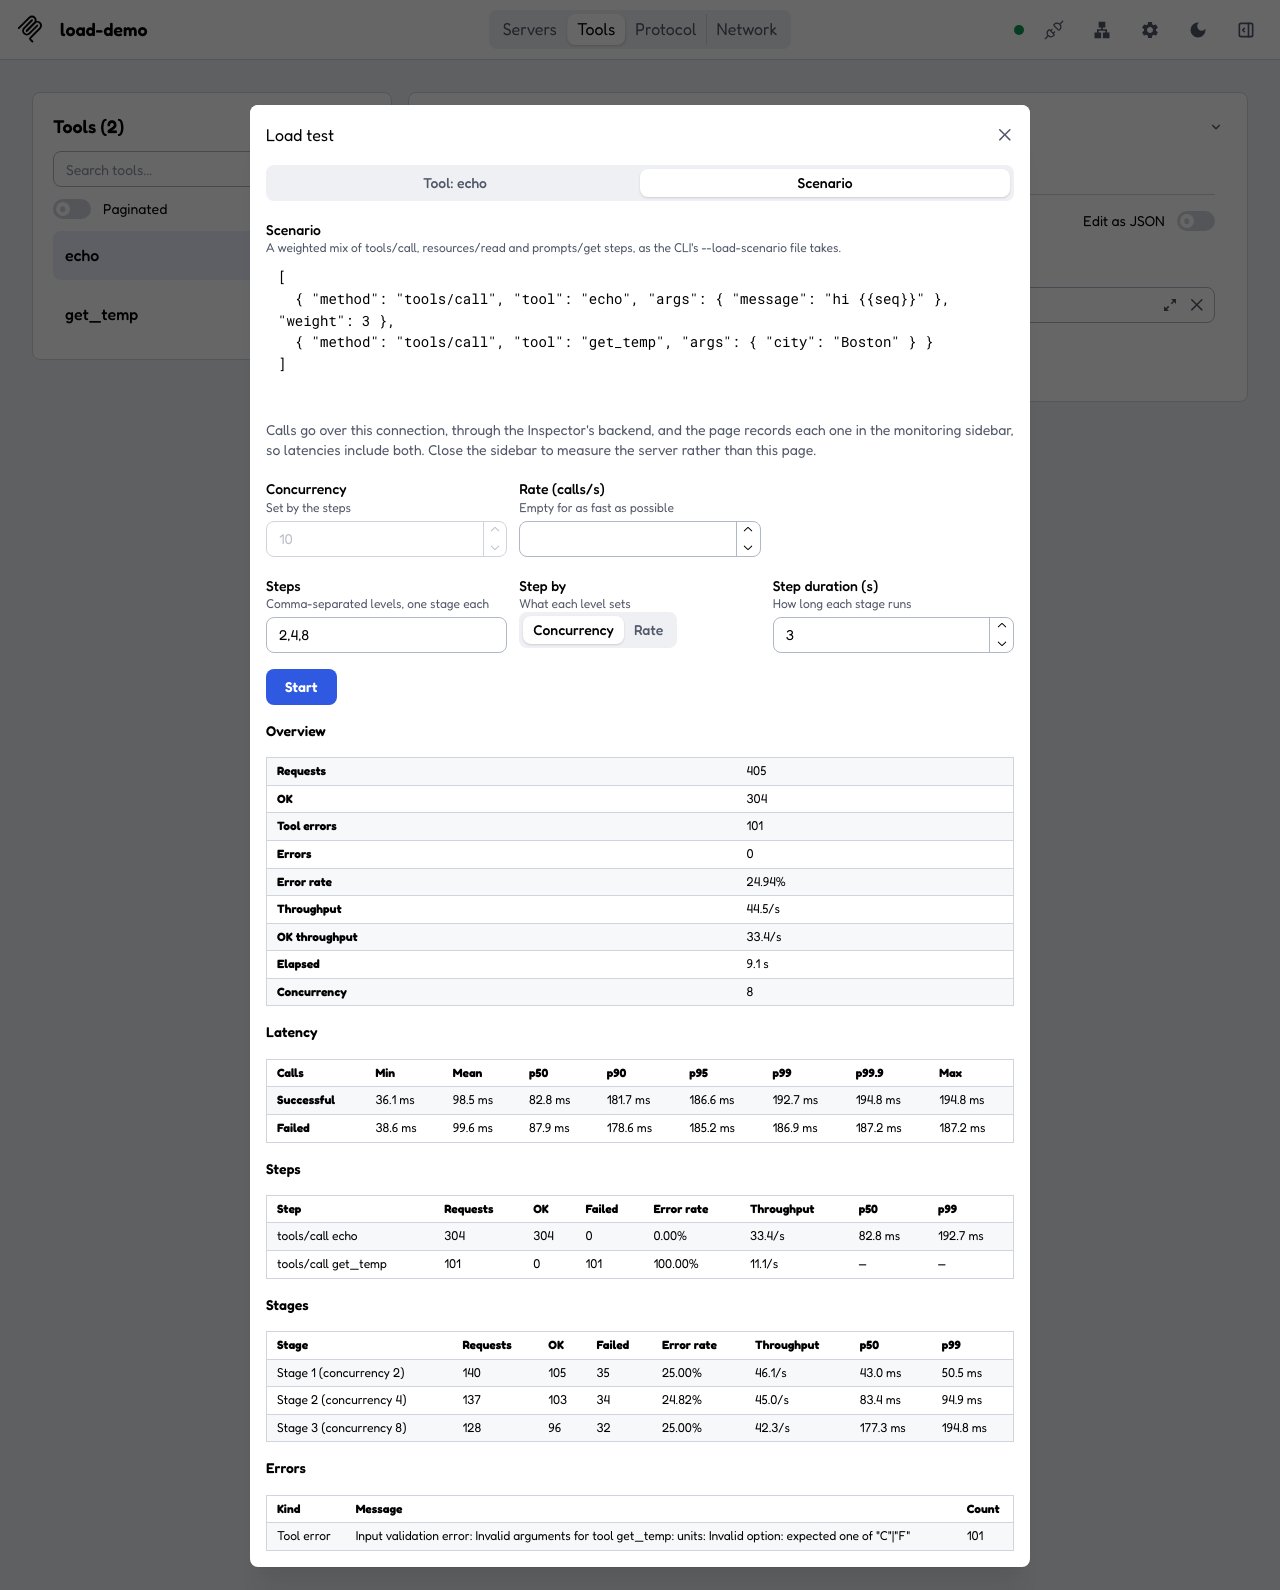
A two-step scenario stepped over concurrency 2, 4 and 8. The get_temp step omits a required argument, so it fails every call, which shows the per-step rows, the per-stage rows and the error tally.
From the command line
The same runs, from the CLI and from mcpdo:
The other
--load-* flags shape the traffic or judge the result, and each group is covered below:
Each
--load-* flag requires --load. In the CLI, --load is rejected with any method other than tools/call, and with --app-info, --output-format, --list-stored-auth and --print-handoff. Each of those mistakes, and each pair of --load-* flags that cannot be combined, exits 1 with the envelope code load_flag_conflict.
The summary
The web client shows the summary as tables. On the command line it goes to stdout in one of three shapes:--format text, or no--formatwhen stdout is a terminal: a short, readable table, in colour unlessNO_COLORis set. mcpdo prints the same one.--format json: the summary wrapped in{ "result": … }.- No
--formatwhen stdout is a pipe or a file: the bare summary as pretty-printed JSON, so scripts written against earlier releases keep working. Pass--format jsonto be explicit.
toolErrorscounts results that carryisError: true, meaning the tool ran and reported a failure.errorscounts calls that never produced a result, such as protocol errors, request timeouts or a dropped connection.errorRateis both together overrequests, rounded to four places.errorMessagesgroups the thrown messages by frequency. It keeps the first ten distinct messages and counts any others under(other).toolErrorMessagesdoes the same forisErrorresults, using the first text block of each, cut to 200 characters, so a run where every call returnedrate limitedsays so.- Latency is measured per call on the client, in milliseconds.
latencyMscovers the successful calls only, anderrorLatencyMscovers the failed ones, so failures that return instantly can’t make a struggling server look fast. Either isnullwhen it has no calls.throughputcounts every completed call per second, andokThroughputcounts only the successful ones. - Percentiles are
p50,p90,p95,p99andp999(the 99.9th), by nearest rank. Memory stays bounded however long the run: the first 10,000 latencies of each kind are kept exactly, so a short run’s percentiles are exact, and later ones fold into a histogram whose percentiles are within 1% of the exact value.min,maxandmeanare always exact. plannedStarts,droppedSlotsandachievedRateappear only with--load-rate. Starts follow an even1/rategrid. A slot missed because every worker was busy is dropped rather than made up later, so a stall is never followed by a burst. A server too slow for the target rate can then report healthy latency while most of the planned load never ran, so when fewer than 90% ofplannedStartswere started, a warning goes to stderr (dropped by--quiet). Raise--load-concurrency, lower the rate, or switch to open loop. Rates in the high hundreds per second and above are reached only approximately.stoppedEarlyappears when the run ended before its bounds, with areasonand adetail. See When a run fails or stops.- Other blocks appear only when the mode that fills them is on:
stepsfor a scenario,stagesfor a stepped run,intervalsandwarmupfor those flags,openLoop,connections,churn,fanoutandworkers. A default run’s summary has none of them.
--load-duration stops new calls, but calls in flight are allowed to finish, so elapsedMs can exceed the window by up to one call. A run that reaches its --load-duration is measured over that whole window at least, so a --load-rate 1 run over five seconds reports 1 call per second. Each call is still bounded by the server’s request timeout (requestTimeout in the catalog or config file).
Watching a run
- Progress. Every
--load-progressseconds a line goes to stderr with the totals so far, plus the completion rate and the p50 and p99 of the successful calls over the last interval, such as[load 12.0s] 1234 calls (1230 ok, 4 failed), 102.3/s, p50 12.1 / p99 40.2 ms. It is prefixedwarm-upduring a warm-up andstage Nin a stepped run.--quietturns it off, and it never reaches stdout. - Time series.
--load-interval <sec>adds anintervalsarray: the run’s calls bucketed by completion time, one entry per interval with empty ones included, so a GC pause or a slow leak in the middle of a run shows instead of averaging away. Each entry hasstartMsandendMs, then the same counts, rates, latencies and message tallies as the totals. - Warm-up.
--load-warmup <sec>runs that long first, over the same connections, and leaves those calls out of every figure.--load-durationand--load-requestsbound the measured part only, andwarmupreports what the warm-up ran. If the warm-up stops early, the run ends there and nothing is measured. It is refused with--load-stepsand--load-ramp, where the first stage already plays that part.
Saving every call
In the CLI, with--load, --output <path> writes one NDJSON line per measured call, for analysis the summary can’t do: your own histogram, a scatter over time, or a join against server logs. The summary still goes to stdout.
seqis the run-wide call number andworkeris the worker that made the call.startMsis measured from the start of the run, or of the stage in a stepped run.outcomeisok,tool_error(with the result’s text asmessage) orerror(with the thrown message). A scenario addsstep, and a stepped run addsstage.- Lines are in completion order. Warm-up calls are not written.
--output-formatis refused with--load. A file that can’t be written exits1(output_write_failed) after the summary is printed.
Varying the arguments
A server that caches results or dedupes identical requests looks far faster under one fixed argument than under real traffic. Two ways to vary each call’s arguments can be used together:--tool-arg, --tool-args-json, an args-file row, and a scenario step’s args and uri), and only in a --load run:
A value that is exactly one numeric placeholder, like
page={{rand:1-50}}, is sent as a number, so an integer-typed argument receives an integer. A placeholder inside other text, like user-{{seq}}, yields a string. Anything else in double braces is sent as written, so an argument that is itself a template is untouched. A {{rand:…}} with reversed or out-of-range bounds exits 1 (load_args_invalid) before anything connects.
--load-args-file <file> is NDJSON, one JSON object per line. Each call takes the next row in turn (or a random one with --load-args-random), cycling, and merges it over the --tool-arg and --tool-args-json arguments, with the row winning on a shared key. Placeholders inside a row are substituted too. A file that can’t be read, or a line that isn’t a JSON object, exits 1 (load_args_invalid). It can’t be combined with --load-scenario, whose steps carry their own args.
Scenarios
Real traffic is rarely one tool with fixed arguments.--load-scenario <file> runs a weighted mix of tools/call, resources/read and prompts/get steps over the same connections and bounds:
- The file is that object or a bare array of steps. Each step has a
methodand what it calls (tool,uriorprompt), plus optionalargs(tools and prompts),meta(the request’s_meta),weight(a positive number, default1) andname. Any other key is an error, so a typo such as"argument"fails the run instead of silently sending no arguments. Every problem with the file exits1(load_scenario_invalid) before anything connects. - The mix is exact, not random. Steps are picked by smooth weighted round-robin, so weights
7:2:1start exactly 7, 2 and 1 calls in every 10, interleaved, and two runs of the same scenario are comparable. - The summary keeps its totals at the top level, so the thresholds judge the whole mix, and adds a
stepsarray with each step’sname,method,targetandweightfollowed by the same counts, rates, latencies and messages as the totals, for that step alone. - Tools are checked up front; resources and prompts are not. A missing tool exits
5(tool_not_found) before the clock starts. A server may serve URIs or prompts it doesn’t list, so a bad one shows up as that step’serrors. --load-scenarioreplaces--tool-name,--tool-arg,--tool-args-jsonand--tool-metadata, so combining it with any of them is refused.--method tools/callis still required, since it selects the load mode.
Stepped and ramped load
One concurrency or rate shows how a server behaves at one load level. To find where latency or errors start climbing, run consecutive stages at rising levels in one run, with one summary row per stage:--load-steps <list>runs one stage per level.--load-ramp <from>:<to>:<sec>is a staircase ofsec / --load-step-durationstages with levels spaced evenly fromfromtoto, both included. Stairs rather than a continuous ramp give every level enough time to measure and a row of its own.--load-step-bysays what a level sets.concurrency(the default) is calls in flight, so--load-concurrencyis refused.rateis calls started per second over a fixed pool of--load-concurrencyworkers, so--load-rateis refused.- Each stage runs for
--load-step-durationseconds (default10), so--load-durationand--load-requestsare refused. Connections are opened once and serve every stage. - The summary keeps its totals at the top level, across every stage, and adds a
stagesarray with one full summary per stage that ran, each carryingstage,stepByandlevel. - Any early stop ends the run. With
--load-stop-on-breach, which needs a threshold, so does the first stage that breaches one, withstoppedEarly.reasonthreshold_breached. Without it every stage runs, and the run still exits10if any stage breached.
Open loop
By default--load-rate is closed-loop: a slot that no worker is free to take is dropped, so a server too slow for the rate is sent fewer requests and its latency looks healthier than its users would see. --load-open-loop keeps the rate grid as the arrival schedule instead:
- No slot is dropped while the run lasts. A slot that comes due while every worker is busy waits, and starts as soon as one frees.
- Each call is timed from its scheduled start, so the wait for a worker counts in its latency, and queueing behind a slow server shows in
latencyMs. --load-concurrencystill caps the calls in flight. Slots still waiting when the window closes are reported indroppedSlots, and the summary carries"openLoop": true.- It needs
--load-rate, or--load-step-by rate, whose stages then all run open loop.
When a run fails or stops
The tool is looked up once before the clock starts, so a missing tool exits5 instead of reporting a 100% error rate. Otherwise a completed run exits 0 whatever its error rate, because the summary is the result, unless a threshold is set.
A server that dies mid-run would otherwise turn the rest of the window into thousands of instant failures, so the run stops early once 50 calls in a row have thrown, or calls have done nothing but throw for a full second. Only thrown calls count: a tool error is the server answering. The summary covers what completed and carries "stoppedEarly": { "reason": "consecutive_errors" }, with a warning on stderr. The exit code is unchanged.
The first Ctrl+C or SIGTERM stops new calls, lets the in-flight ones finish, prints the summary of what completed with stoppedEarly.reason interrupted, and exits 130 (envelope code interrupted) without checking any threshold. A second Ctrl+C exits 130 immediately.
A load run does not prompt for OAuth step-up. A tool that needs scopes the session lacks fails every call, and the challenge shows in errorMessages. Run one plain tools/call of the tool first to grant the scopes, then load it.
Thresholds
Set a threshold to gate a CI job on the run without parsing the summary:- The full summary prints first either way. A breach then exits
10with an error envelope on stderr. When several are breached, the message lists them all and thecodenames the first in the table’s order. - A value equal to the threshold passes. The error-rate check uses the exact share of failed calls (
toolErrorspluserrors, overrequests), not the roundederrorRate, so--load-max-error-rate 0fails on a single failure. - The latency checks judge the successful calls, so a run where half the calls fail instantly can’t pass on the speed of its failures. A run where no call succeeded has no latency to compare, and fails.
--load-min-throughputlikewise counts only successful calls. - A stepped run is judged stage by stage, and the message names the first stage that breached.
Comparing against a baseline
An absolute threshold has to be picked, and re-picked as the server changes. To gate on “no worse than last time” instead, save one run’s summary and compare later runs against it:- Four figures are compared: p50 and p99 of the successful calls and
okThroughputby relative change, and the error rate in percentage points, since a healthy baseline’s error rate is usually0and any relative change from it is infinite. - The comparison prints on stderr after the summary, one line per figure (dropped by
--quiet). Without--load-max-regressionit only reports. With it, a figure worse than the baseline by more than the budget exits10(load_regression). Absolute thresholds are judged first. - The two runs must have the same shape: the same tool or scenario steps, concurrency, duration, request count, rate, open loop, connections, churn and stages. Otherwise the run exits
1(load_baseline_mismatch) and lists every difference, rather than comparing numbers that mean different things. A stepped run is compared stage by stage. - The baseline is read before anything connects. Either JSON shape is accepted: the CLI’s
{ "result": … }envelope, or the bare summary that mcpdo and a piped run print. A file that isn’t a summary, or a baseline run that stopped early, exits1(load_baseline_invalid).
Multiple sessions
By default all calls share one connection, so a run measures how a server copes with concurrent requests on a single session.--load-connections <n> opens n independent connections with the same transport, headers and OAuth. Use it to see per-session state, session setup cost, connection limits and contention that only appear across sessions.
-
HTTP and SSE only. Over stdio, every connection would spawn its own server process, which tests
nisolated servers rather than one server undernsessions. More than one connection over stdio exits1(load_flag_conflict). -
--load-concurrencyand--load-rateare totals across all connections. Workers are split as evenly as the counts allow, so--load-connectionscan’t exceed--load-concurrency. -
Setup is excluded from latency. Every connection opens before the clock starts. Their connect times are reported separately in
connections.connectMs. -
A connection that fails to open is not a call error. The run continues on the connections that opened, and the failures are counted under
connections, never inerrorsorerrorRate: - OAuth. The extra connections reuse the first connection’s token and never start a sign-in of their own. Against a server that rotates refresh tokens, two connections refreshing an expired token at the same moment can lose a refresh, which shows up as call errors.
Session churn
--load-connections opens its sessions once and keeps them, so session setup, per-session state and many short-lived sessions, which is what a server behind a gateway mostly sees, are never under load. With --load-churn, every worker connects, makes --load-churn-calls calls (default 1), disconnects, and starts over:
- Connecting is not in the call latency. The sessions are reported in their own
churnblock:opened,failed,closeFailed,connectMs(handshake included) and the connecterrorMessages. In open loop, a call is timed from its scheduled start, so the connect is inside it there. - A session that fails to open is not a call error, but it does count toward the early stop, so a server refusing every session stops the run in about a second.
- HTTP and SSE only, for the same reason as
--load-connections, and not combined with it. Sessions use stored credentials only, so the CLI’s first connection completes any sign-in. --load-ratepaces a session’s turn, connect included, so a slow handshake shifts calls off the even grid. Slots lost to failed or late connects show asdroppedSlots.
Notification fan-out
A request’s latency says nothing about what it costs a server to fannotifications/resources/updated out to many subscribers, or how long each one waits. --load-subscribe <uri> opens --load-subscribers sessions (default 1), subscribes each to the resource, and measures the notifications instead:
- Triggered, with a tool or scenario: each successful call is expected to update the resource once. Triggers run one at a time (
--load-concurrencymust be1), so each notification can be matched to its call, and delivery latency runs from that call’s start. - Passive, with no tool: nothing is called. The run listens for
--load-duration, and delivery latency runs from the first subscriber’s receipt of each update, so it measures the spread of the fan-out rather than its absolute cost. - After the run, subscribers get
--load-subscribe-waitseconds (default2) to catch up, and whatever hasn’t arrived by then is missed. Thefanoutblock reportsupdates(expected per subscriber),delivered,missed,sessionsMissed,unexpected,deliveryMs, and the setup costsconnectMsandsubscribeMs. - A session that fails to open or subscribe is counted in
failed, and the run continues with the rest. More than one subscriber needs an HTTP or SSE server, and the extra sessions use stored credentials only. Fan-out can’t be combined with--load-connections,--load-churn, stepped load,--load-warmupor--load-open-loop.
Multiple generator processes
One Node process has a ceiling, so at high load the Inspector itself can become the bottleneck rather than the server. In the CLI,--load-workers <n> spreads one run over n generator processes:
- One run, split. The CLI connects once, so any sign-in happens before a worker starts, then re-runs its own command as
nchild processes. Each takes an even share of--load-concurrency,--load-requestsand--load-rate, and connects with stored credentials only. Everything else, such as the duration, warm-up, scenario and argument rows, applies to every worker as given. - One summary, merged exactly. The workers send back their counts, error tallies and latency histograms, and the CLI merges them as if one recorder had seen every call. The summary gains
"workers": n, and thresholds and baselines judge the merged result. - One stop reaches every worker. If one worker stops early, the CLI stops the rest with the same
stoppedEarlyreason. Ctrl+C stops them all and still prints the merged summary. If a worker fails outright, the run exits with that worker’s exit code (load_worker_failed) once the rest have stopped. - The rate and the mix hold across processes. Each worker’s rate grid is offset so the processes interleave into one even spacing, and
{{seq}}and{{worker}}stay unique across them. Progress lines add up every worker’s latest report, with the slowest worker’s p50 and p99, while the final summary’s latencies are exact. ncan’t exceed--load-concurrencyor--load-requests. HTTP and SSE only, since each worker opens its own session. Not combined with stepped load,--load-interval,--load-connections,--load-churn,--load-subscribeor--output. mcpdo has no--load-workers, because its run happens inside the daemon on the connection it holds.
On an mcpdo connection
mcpdo tools/call --load takes every flag above except --output and --load-workers. The default --format text prints the same readable summary table as the CLI, with progress lines on stderr while the run goes. --format json prints the summary object itself, with no { "result": … } envelope, like every other mcpdo command, and asks the daemon for no progress lines. A breached threshold or baseline exits 10 after the summary is printed, with the same envelope code the CLI uses.
How a run differs on a daemon connection:
- The run happens inside the daemon, on the connection’s live client with its transport, headers and OAuth tokens. The
mcpdoprocess makes one round trip for the whole run, so a long--load-durationor a long staircase of stages is not cut off. The connection’s request timeout still applies to each call. - Files are read by
mcpdo, not the daemon. A--load-scenario,--load-args-fileor--load-baselinepath is relative to your working directory. The parsed contents travel to the daemon with the run. - Later commands on the same connection wait for it. A connection runs one call at a time, and the load run is one call, so a
tools/listsent mid-run starts when the run ends. Other connections, and alogging/tailorresources/subscribestream that is already running, are unaffected. - Ctrl+C ends the run. No more calls start and the in-flight ones are cancelled, so the connection is free at once. No summary is printed, since the caller has gone.
- A dropped connection ends the run early with a summary of what completed, marked
"stoppedEarly": { "reason": "connection_lost" }. Calls that were in flight when it dropped count aserrors, undererrorMessagesasAbortError: load run stopped: <detail>. A server that keeps failing calls while the connection stays up stops the run withconsecutive_errors, as in the CLI. The next command revives the connection as usual. - Extra sessions open inside the daemon.
--load-connections,--load-churnand--load-subscribersopen their sessions from the connection’s stored settings, using stored credentials only, so connect first. The connection’s own client is always the first session. The extras never appear inconnections/list, and they close when the run ends. - A connection already subscribed to the
--load-subscriberesource, through a runningresources/subscribestream, is listened on during the run and left subscribed after it. - Elicitations are cancelled. No call can be answered in the middle of a run, so a server that elicits during one sees each request cancelled. Use
connect --elicit offto keep the server from asking.