

npx @modelcontextprotocol/inspector with no mode flag lands here.
The session token
The Node server behind the web client guards every/api/* route with a per-launch token, because it can spawn processes on your machine. The launcher prints a URL containing that token: open that URL, and don’t type localhost:6274 from memory.
The browser recovers the token from three places, in priority order:
window.__INSPECTOR_API_TOKEN__, injected intoindex.htmlon every page load. This is what makes a bare-URL reload or a bookmark keep working.- A
?MCP_INSPECTOR_API_TOKEN=...query string, the form used in that printed URL. sessionStorage, as a backstop.
MCP_INSPECTOR_API_TOKEN environment variable to pin a known token (useful for scripted launches), or set DANGEROUSLY_OMIT_AUTH=true to disable the check entirely, but only on a machine where nothing else can reach the port. Both are described under Web backend environment variables. What the token does and does not protect is described under Security.
Dev mode
--dev is a web-only flag. It runs the Vite dev server instead of serving the pre-built bundle, which matters if you’re working on the Inspector itself:
--web serves a built bundle. In the published package that bundle always ships; in a fresh source checkout it doesn’t, so the runner builds it on demand the first time you launch.
The tab bar
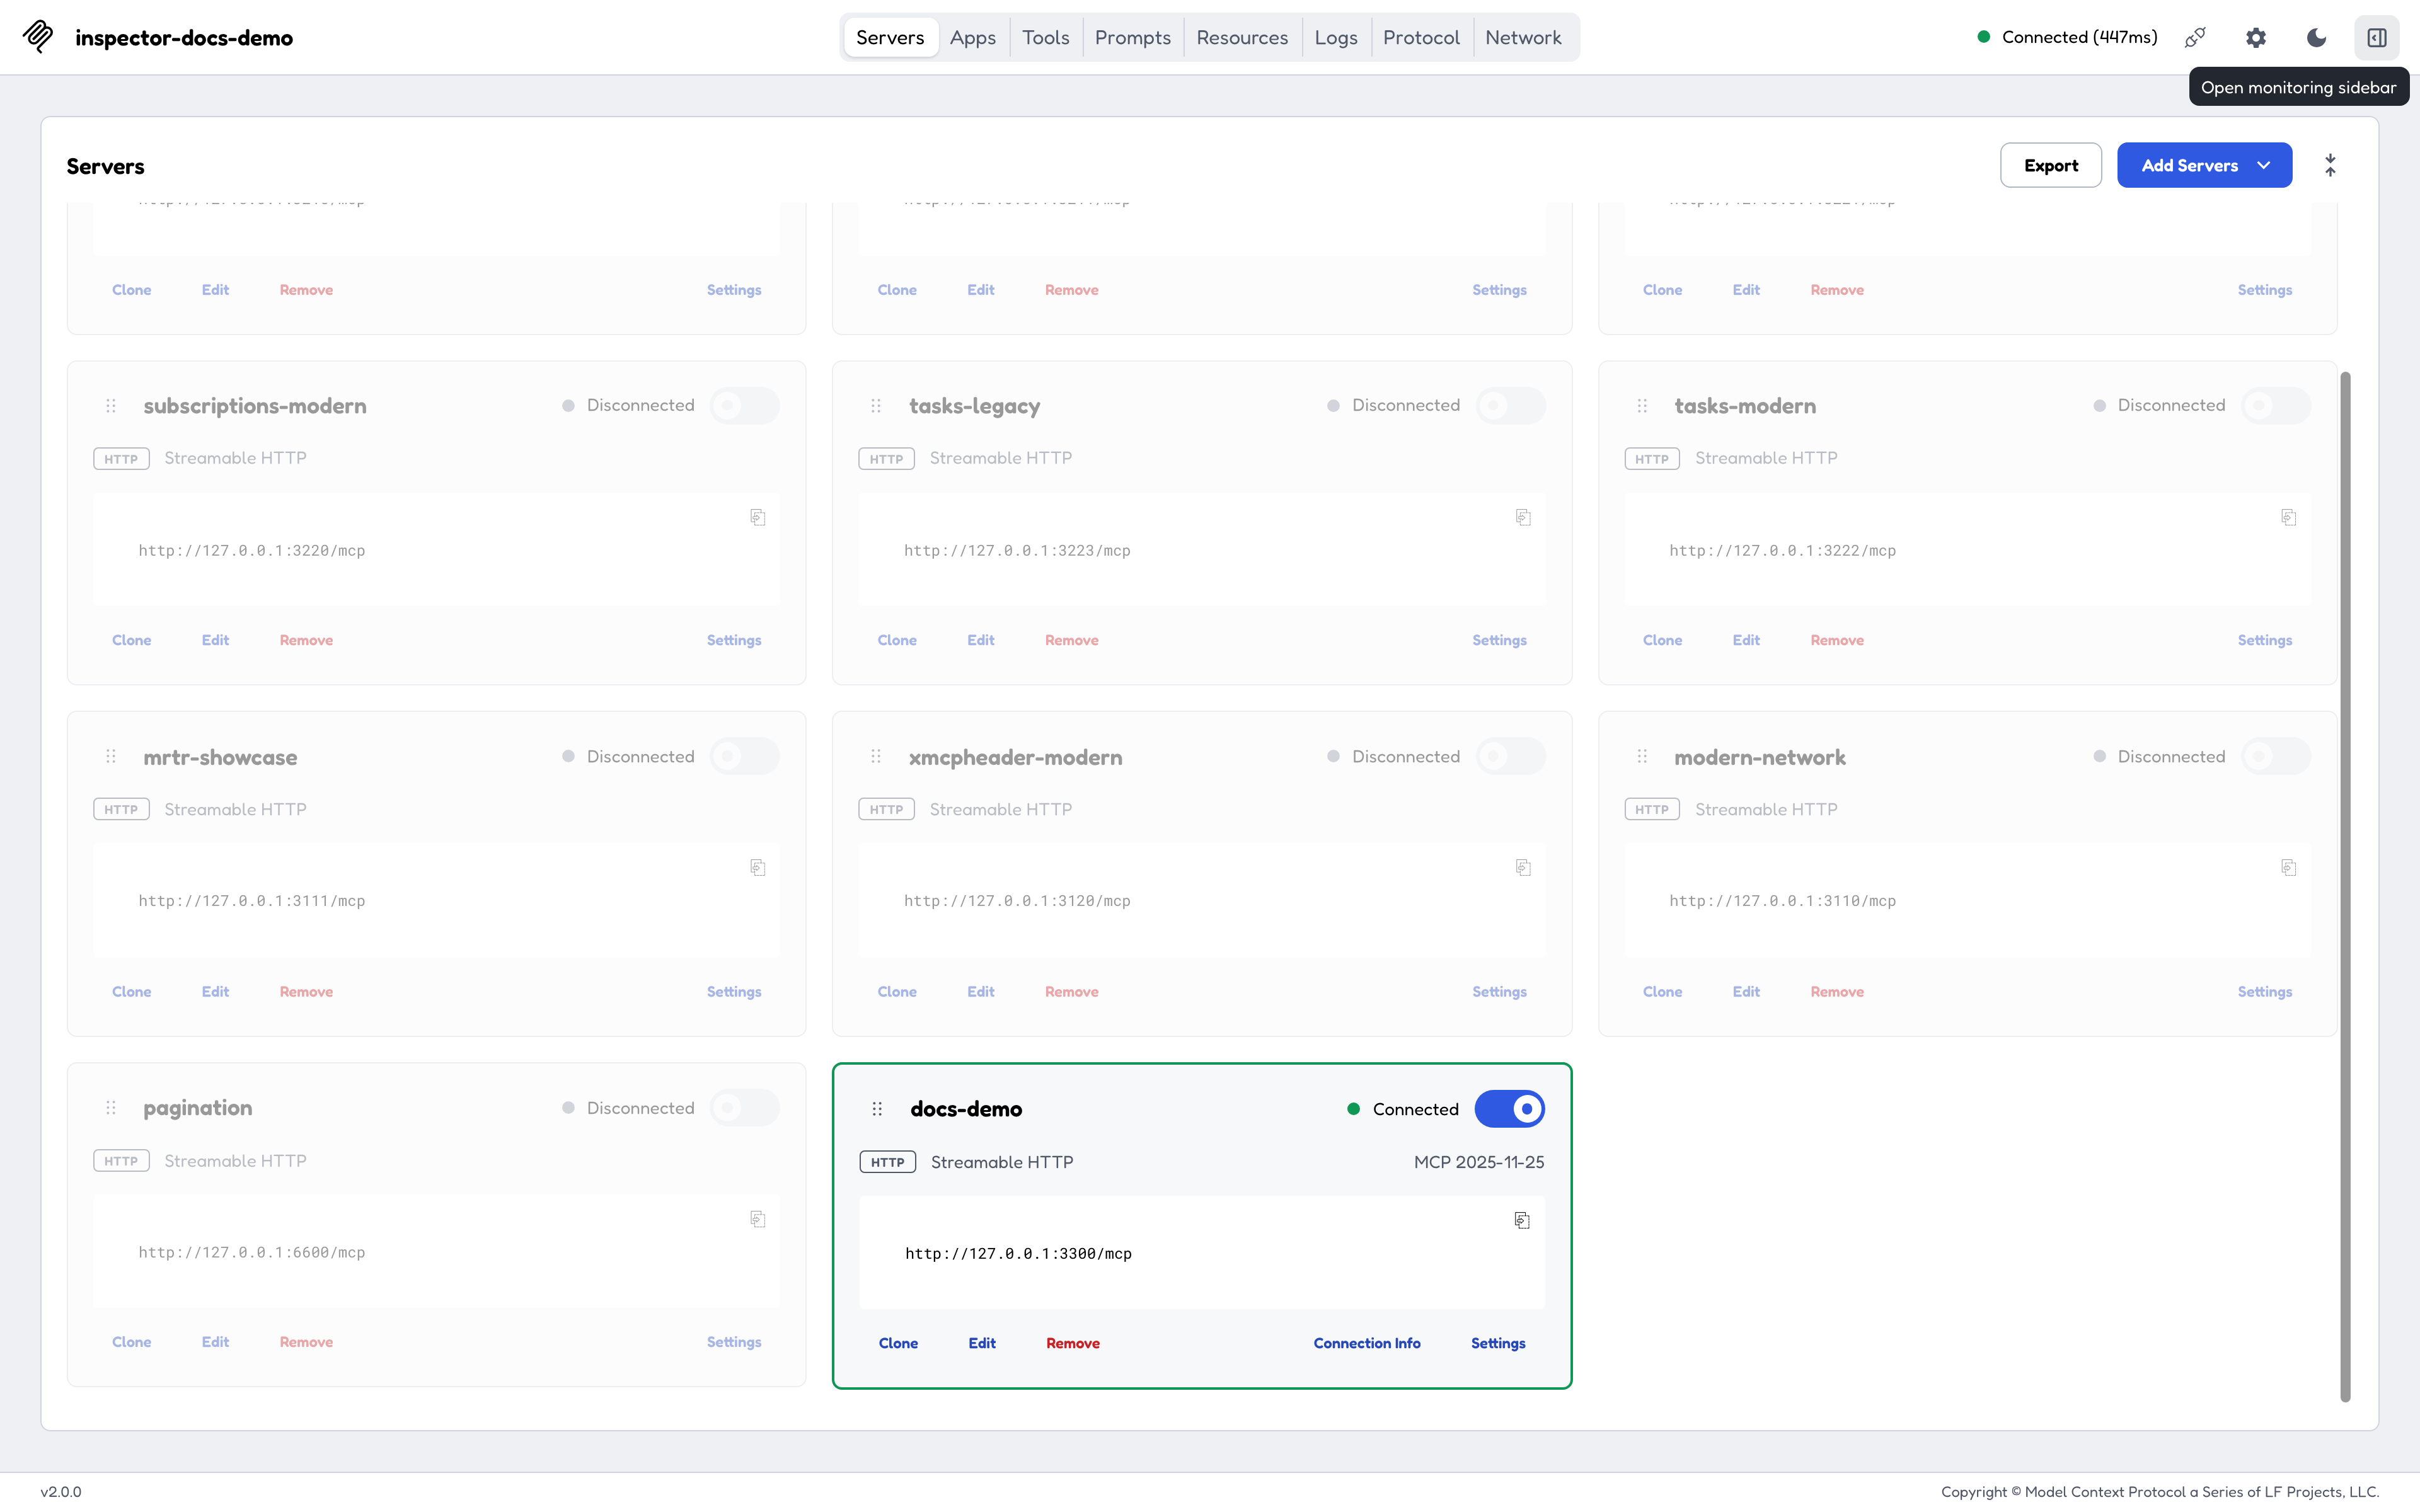
The tab bar on a connected server. Which tabs appear depends on the capabilities the server reported.
The monitoring sidebar
Tasks, Logs, Protocol, Network, and Console form a monitor group. Pin the group and they leave the tab bar and move into a resizable right-hand column, so you can watch traffic while working in Tools or Resources. Drag the column’s edge to resize it, from 320 to 720 pixels wide. The column width and the selected monitor tab persist across reloads.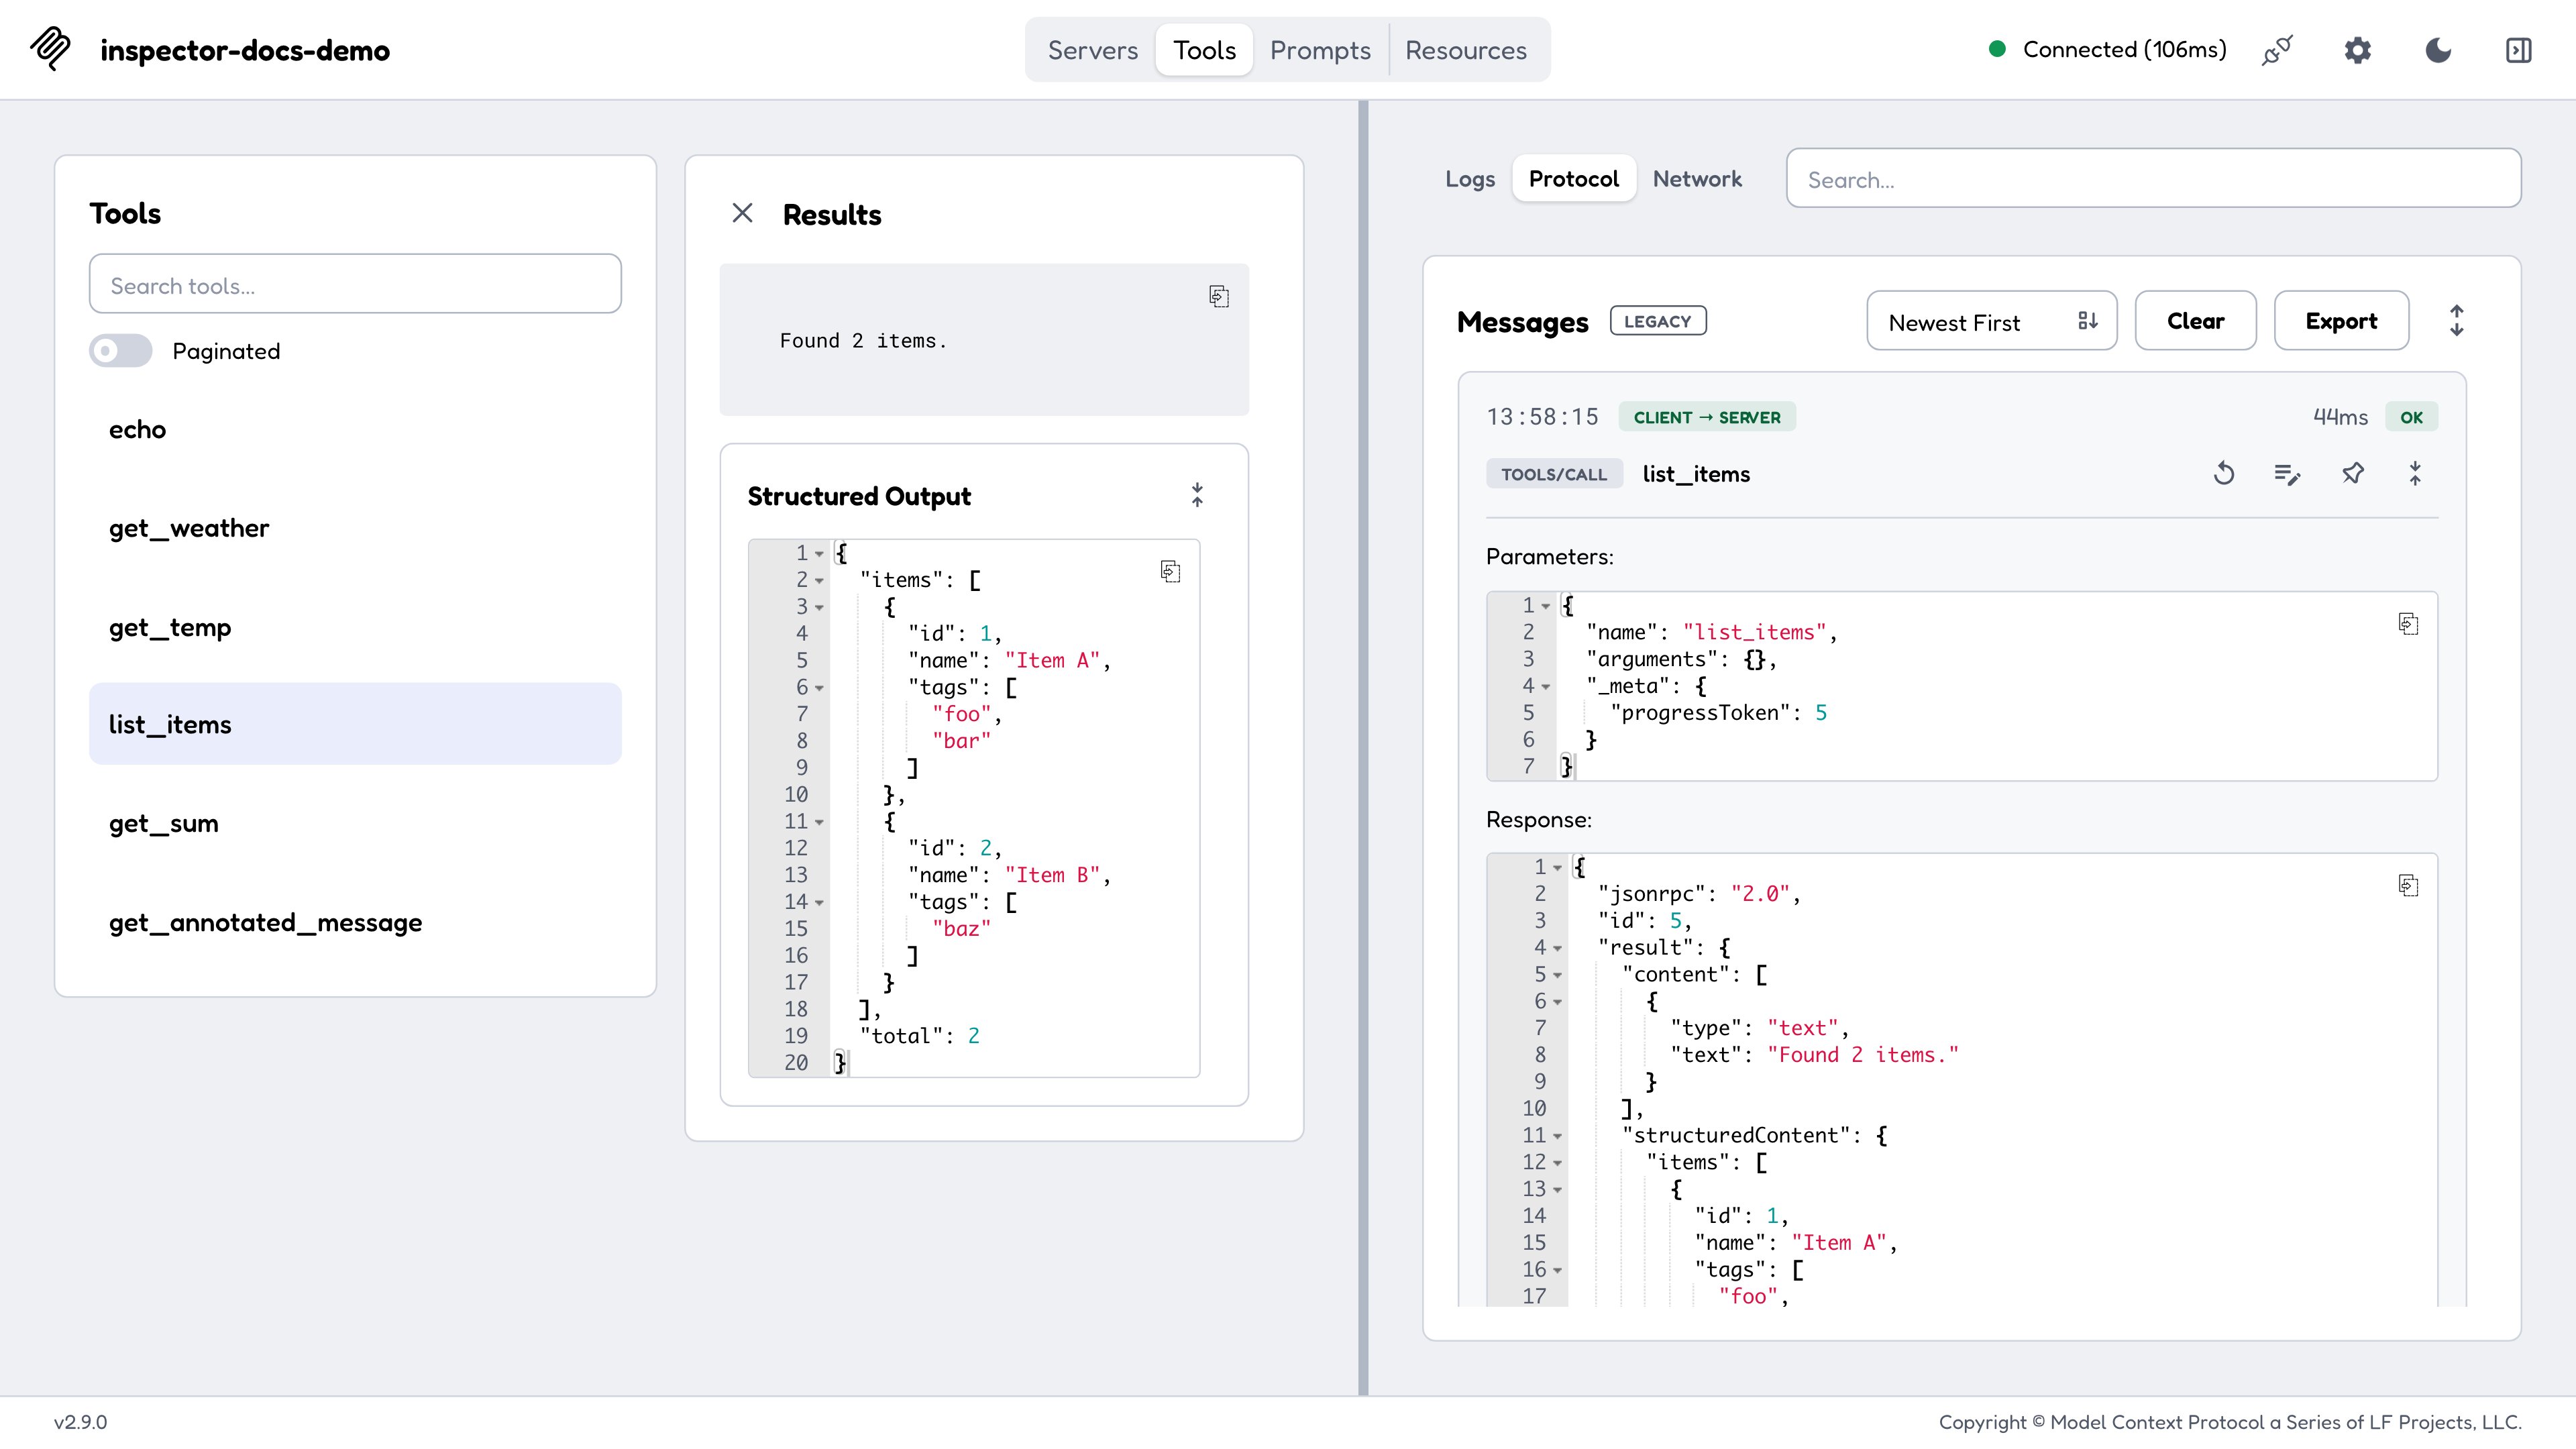
The monitoring sidebar pinned beside the Tools screen and dragged to its full width, with the tool call's request and response expanded in the Protocol stream.
Servers
The Servers screen is the entry point. A server row carries its transport, its connection state, and a control that opens its per-server settings. Where that list comes from, and whether it’s editable, depends on how you launched:/tmp, the canonical “everything” reference server, and the MCP org’s hosted example server (Streamable HTTP, with OAuth via dynamic client registration). See Configuration and flags for the full rules, including why the CLI and TUI seed an empty catalog instead.
Server Settings
- Protocol Era:
legacy/auto/modern. See Protocol eras. - Log Level per Request: the level a modern-era connection stamps on each outgoing request by default, or
offto opt out (see Logging). - Advertised Extensions: which extensions the Inspector declares in
capabilities.extensions. A debugging knob: a server may legitimately change what it registers based on what you advertise. Uncheck the Tasks extension and reconnect against thetest-servers/configs/advertised-extensions-http.jsonfixture (setup in Reproducing each era locally) to watch a tool disappear. - Roots: the roots advertised via the
rootsclient capability.@modelcontextprotocol/server-filesystem, for instance, callsroots/listto learn its allowed directories. - Headers, timeouts, and OAuth fields. Headers are saved in the catalog as written; OAuth client secrets and stdio
env:values go to the secret store. - OAuth Settings: client ID and secret, a read-only Redirect URI to copy into a pre-registered client (it follows the origin you opened the Inspector at), Scopes (space-separated), Request refresh token, Revoke tokens on clear, additional authorization parameters, authorization and token URL overrides, and Insufficient-scope response, which decides whether a
403 insufficient_scopetriggers step-up or surfaces the error. - Fetch Lists One Page at a Time: when off, list results are auto-aggregated across pages on connect; when on, each list loads page 1 only with a Load next page control and an N pages loaded status. Reproduce with
test-servers/configs/pagination-http.json, which paginates 12 tools, resources, and prompts into three pages each.
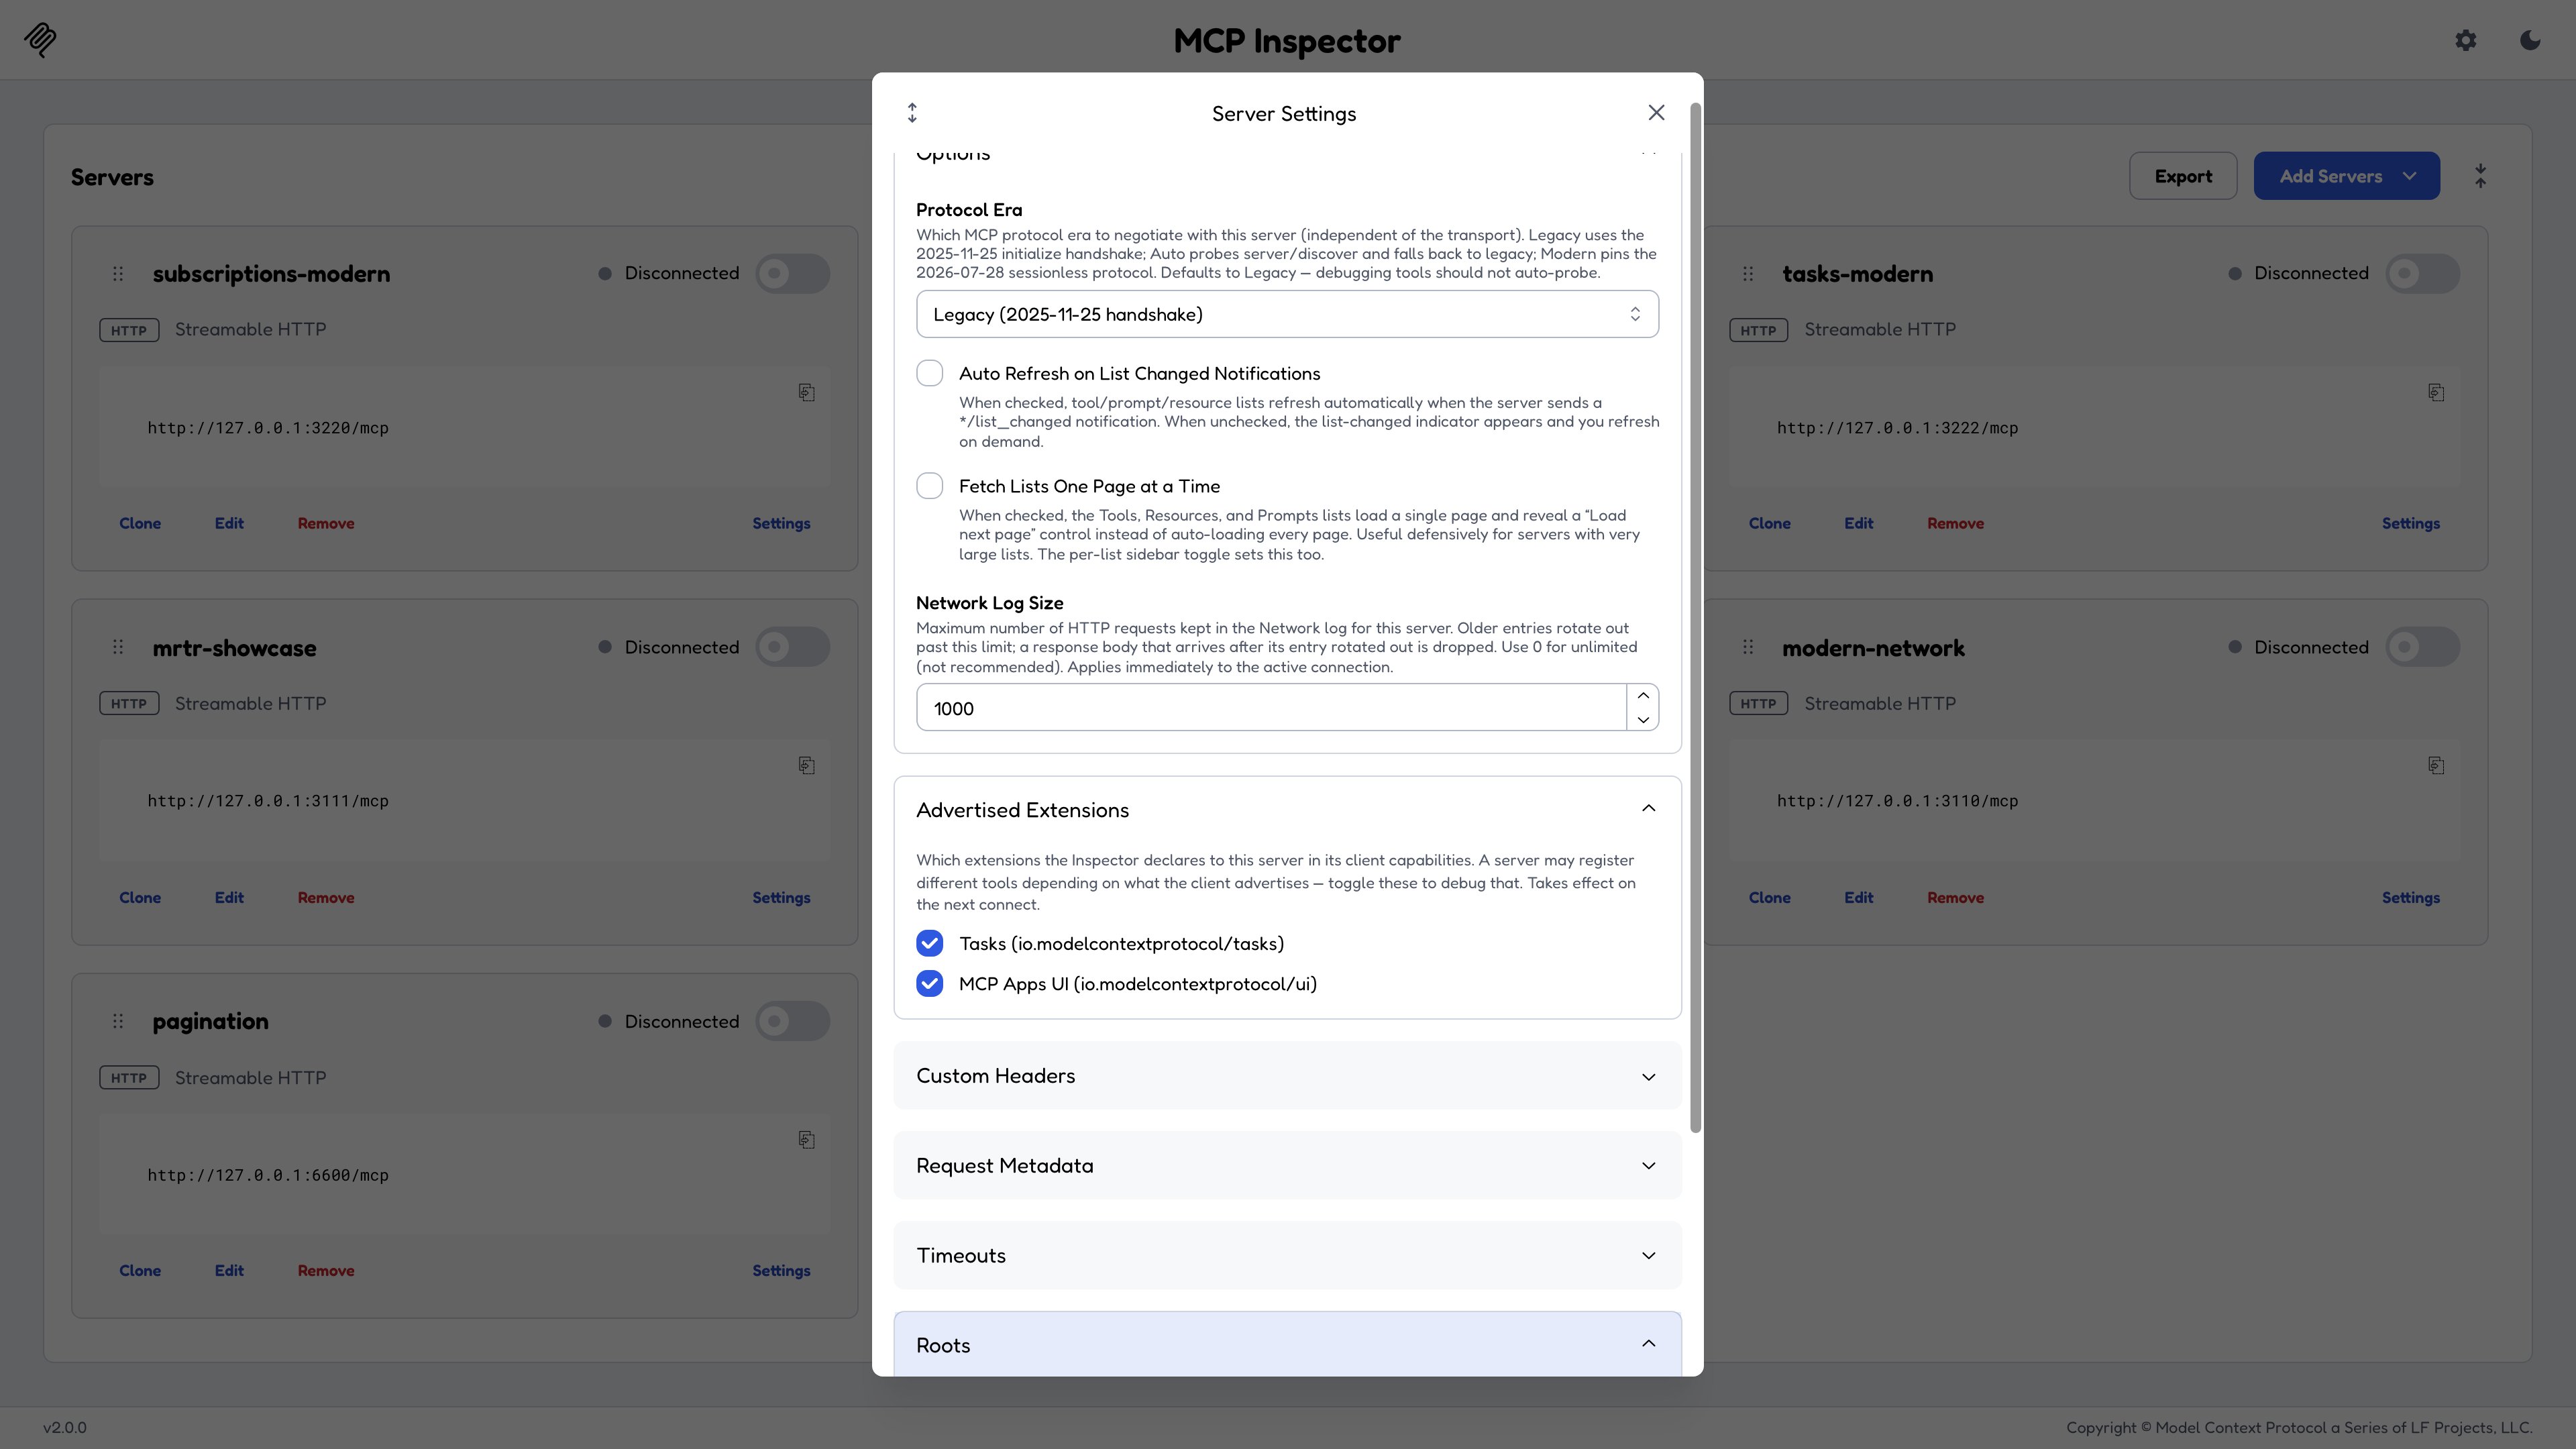
Server Settings with Advertised Extensions expanded. Unchecking one changes what the Inspector declares at connect.
Tools
Select a tool to see its description, its input schema rendered as a form, and its annotations. Fill the form and call it; the result renders below with structured content, embedded resources, and images handled natively. On modern-era servers this screen also shows mirroredMcp-Param-* headers, excluded tools, and distinct -32602 error panels, all covered in Protocol eras.
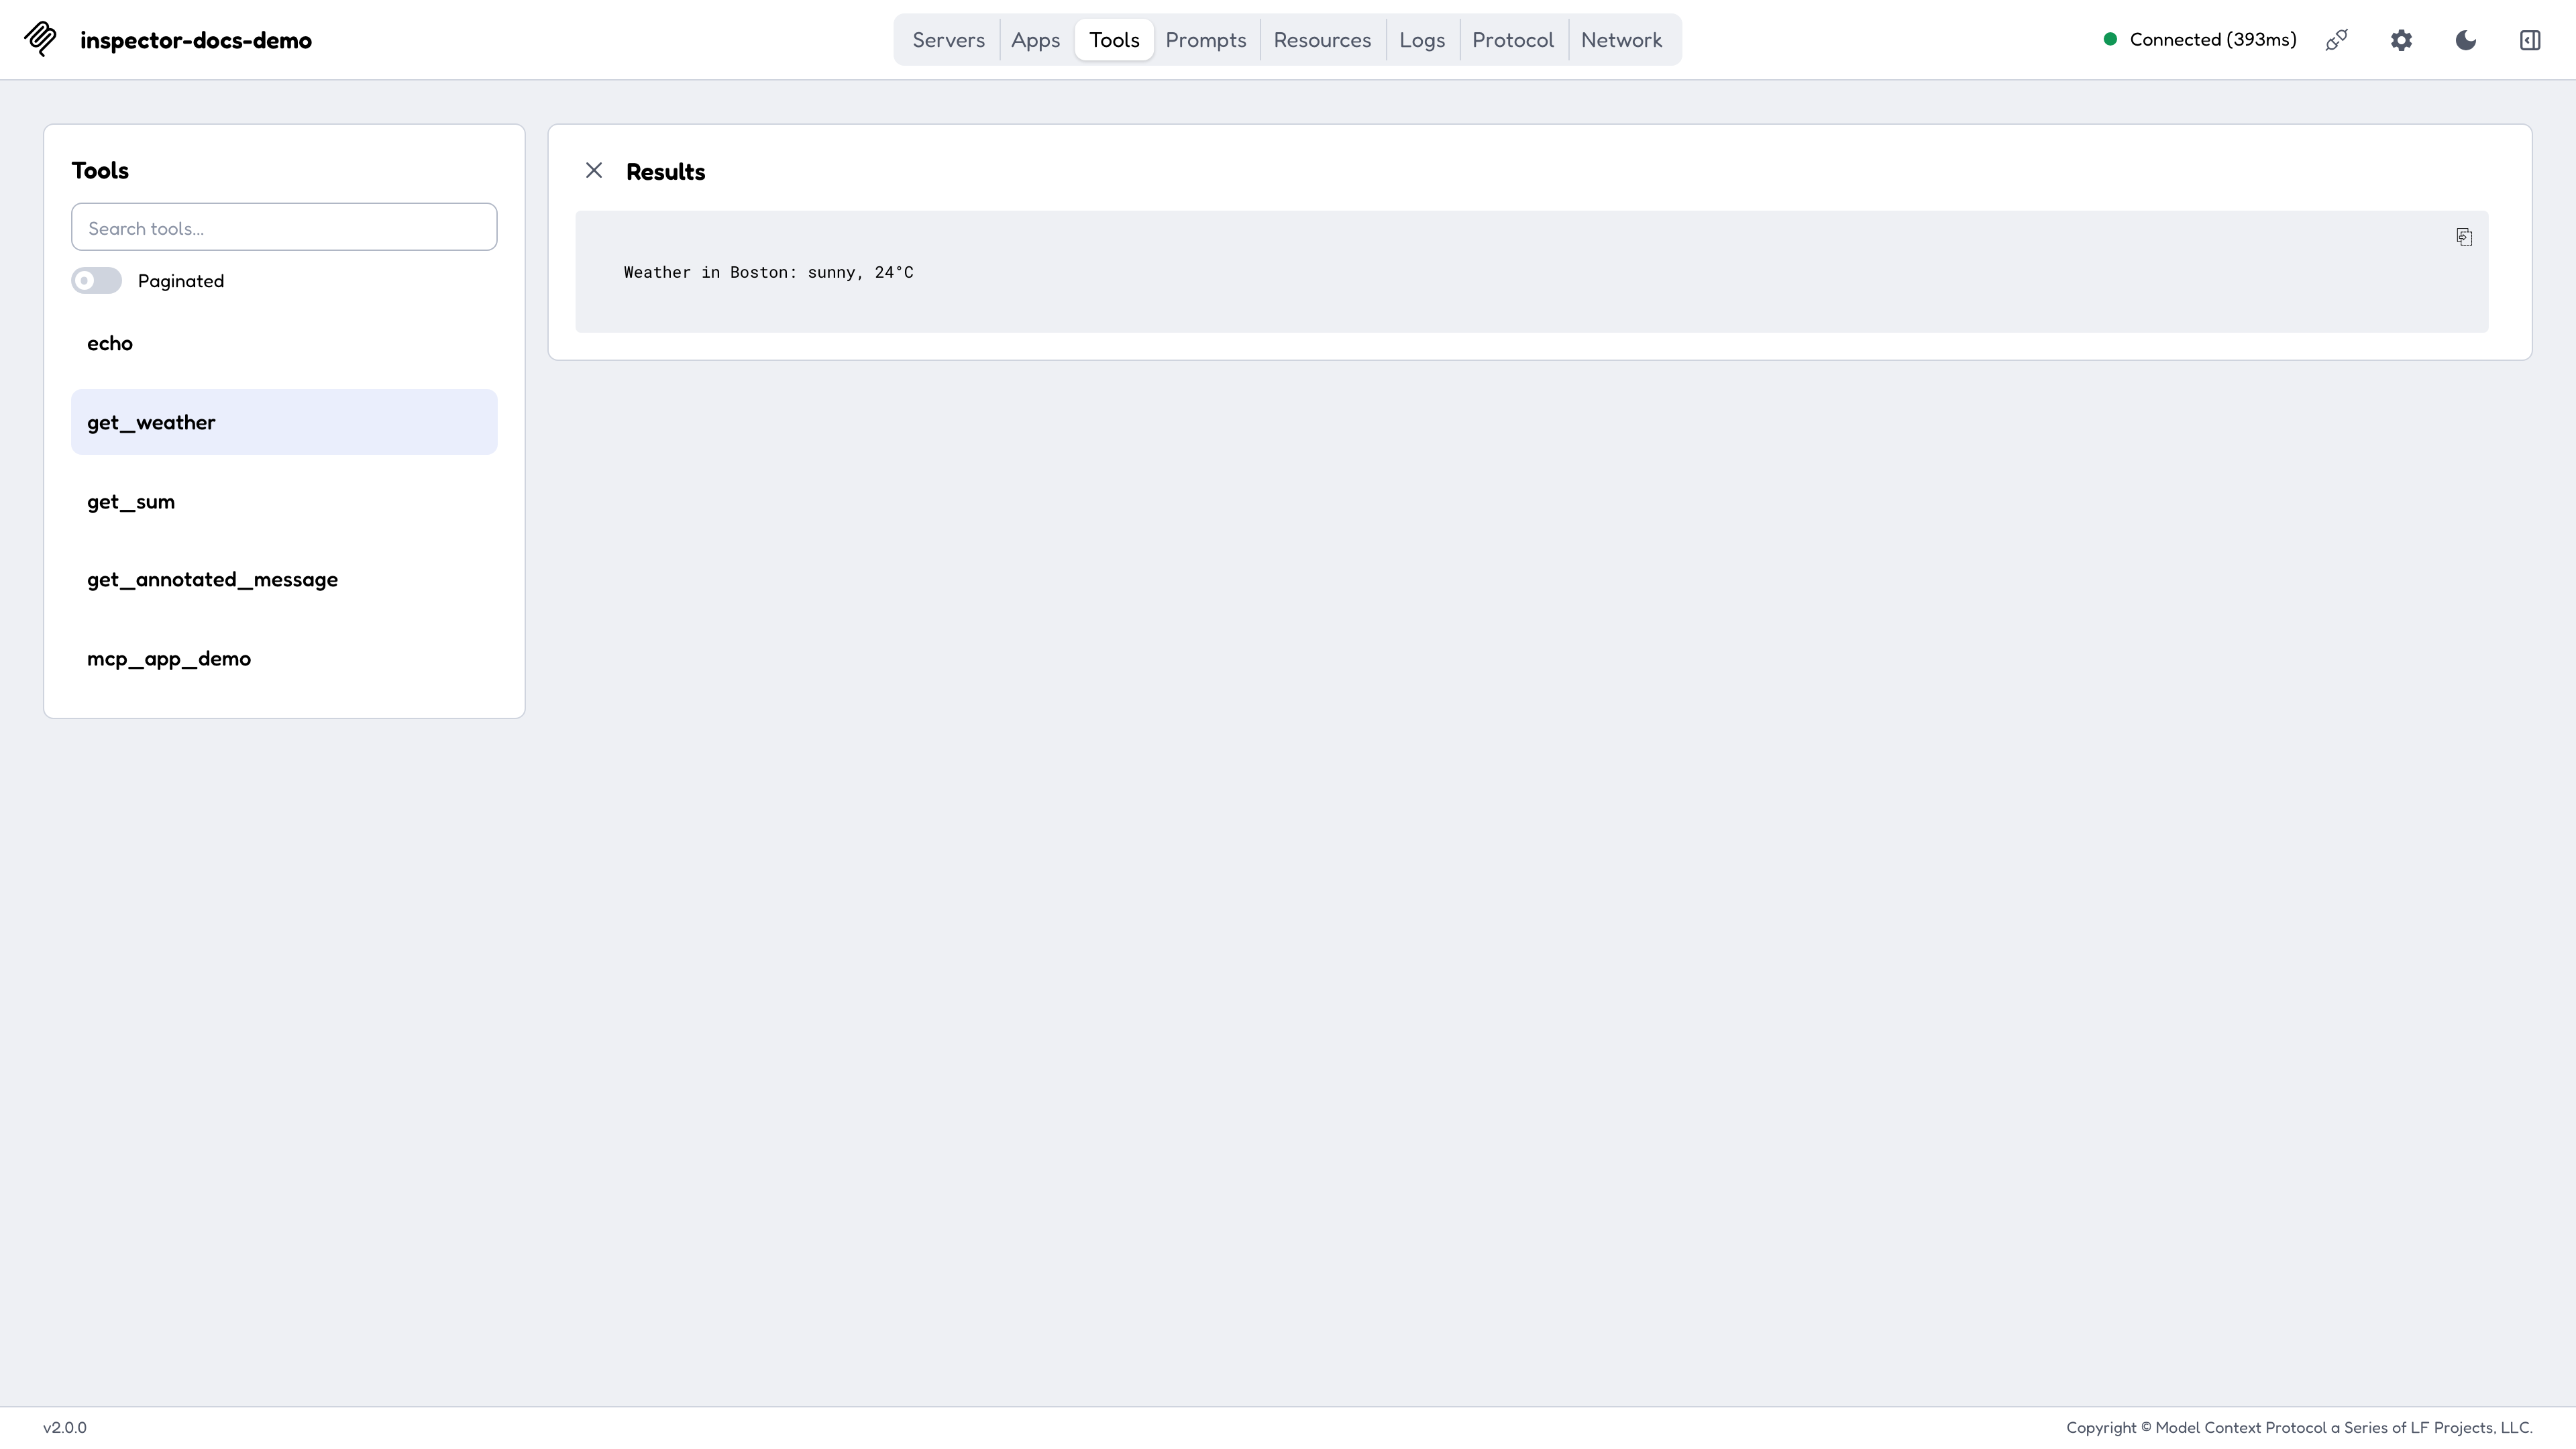
A tool call and its rendered result. The argument form collapses into the result panel once the call returns.
Resources
Lists resources and resource templates with their MIME types and descriptions, reads content on selection, and offers Subscribe on servers that support subscriptions. The subscription mechanics differ by era; see Resource subscriptions.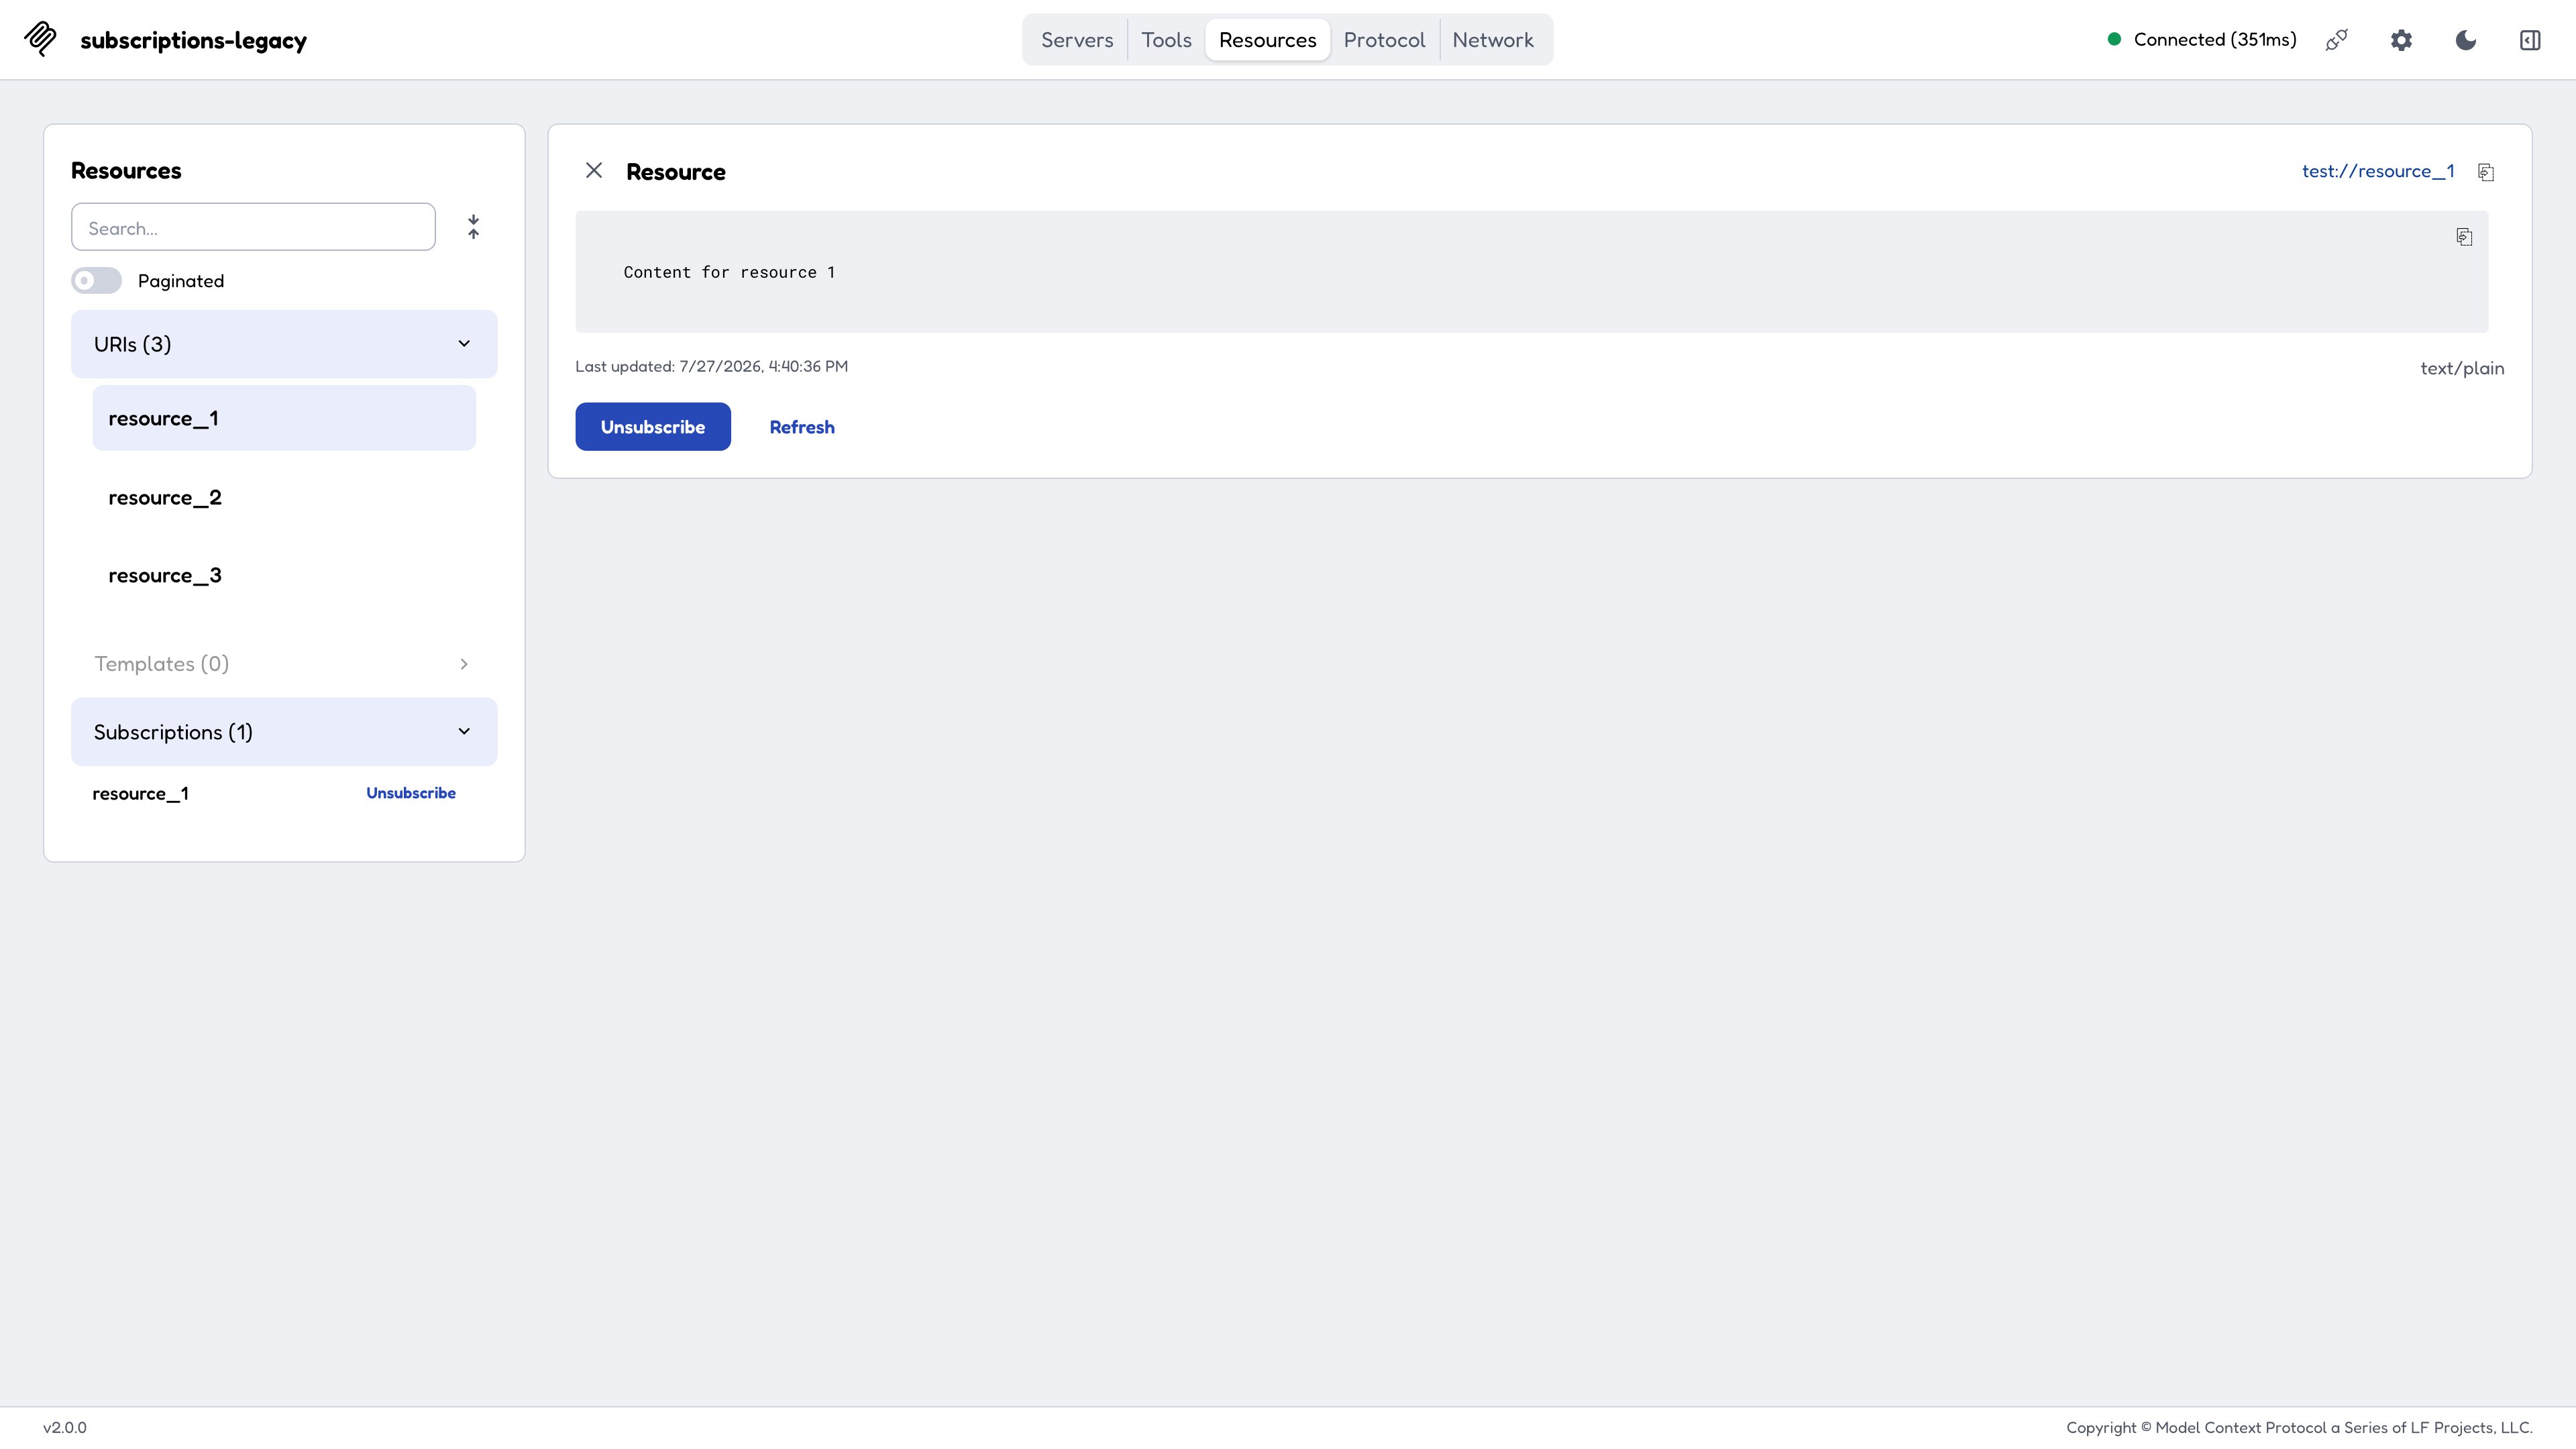
A resource read, with an active subscription listed below the resource list.
Prompts
Lists prompt templates with their arguments, and renders the generated messages for the arguments you supply, which is the fastest way to confirm a prompt produces what you intended.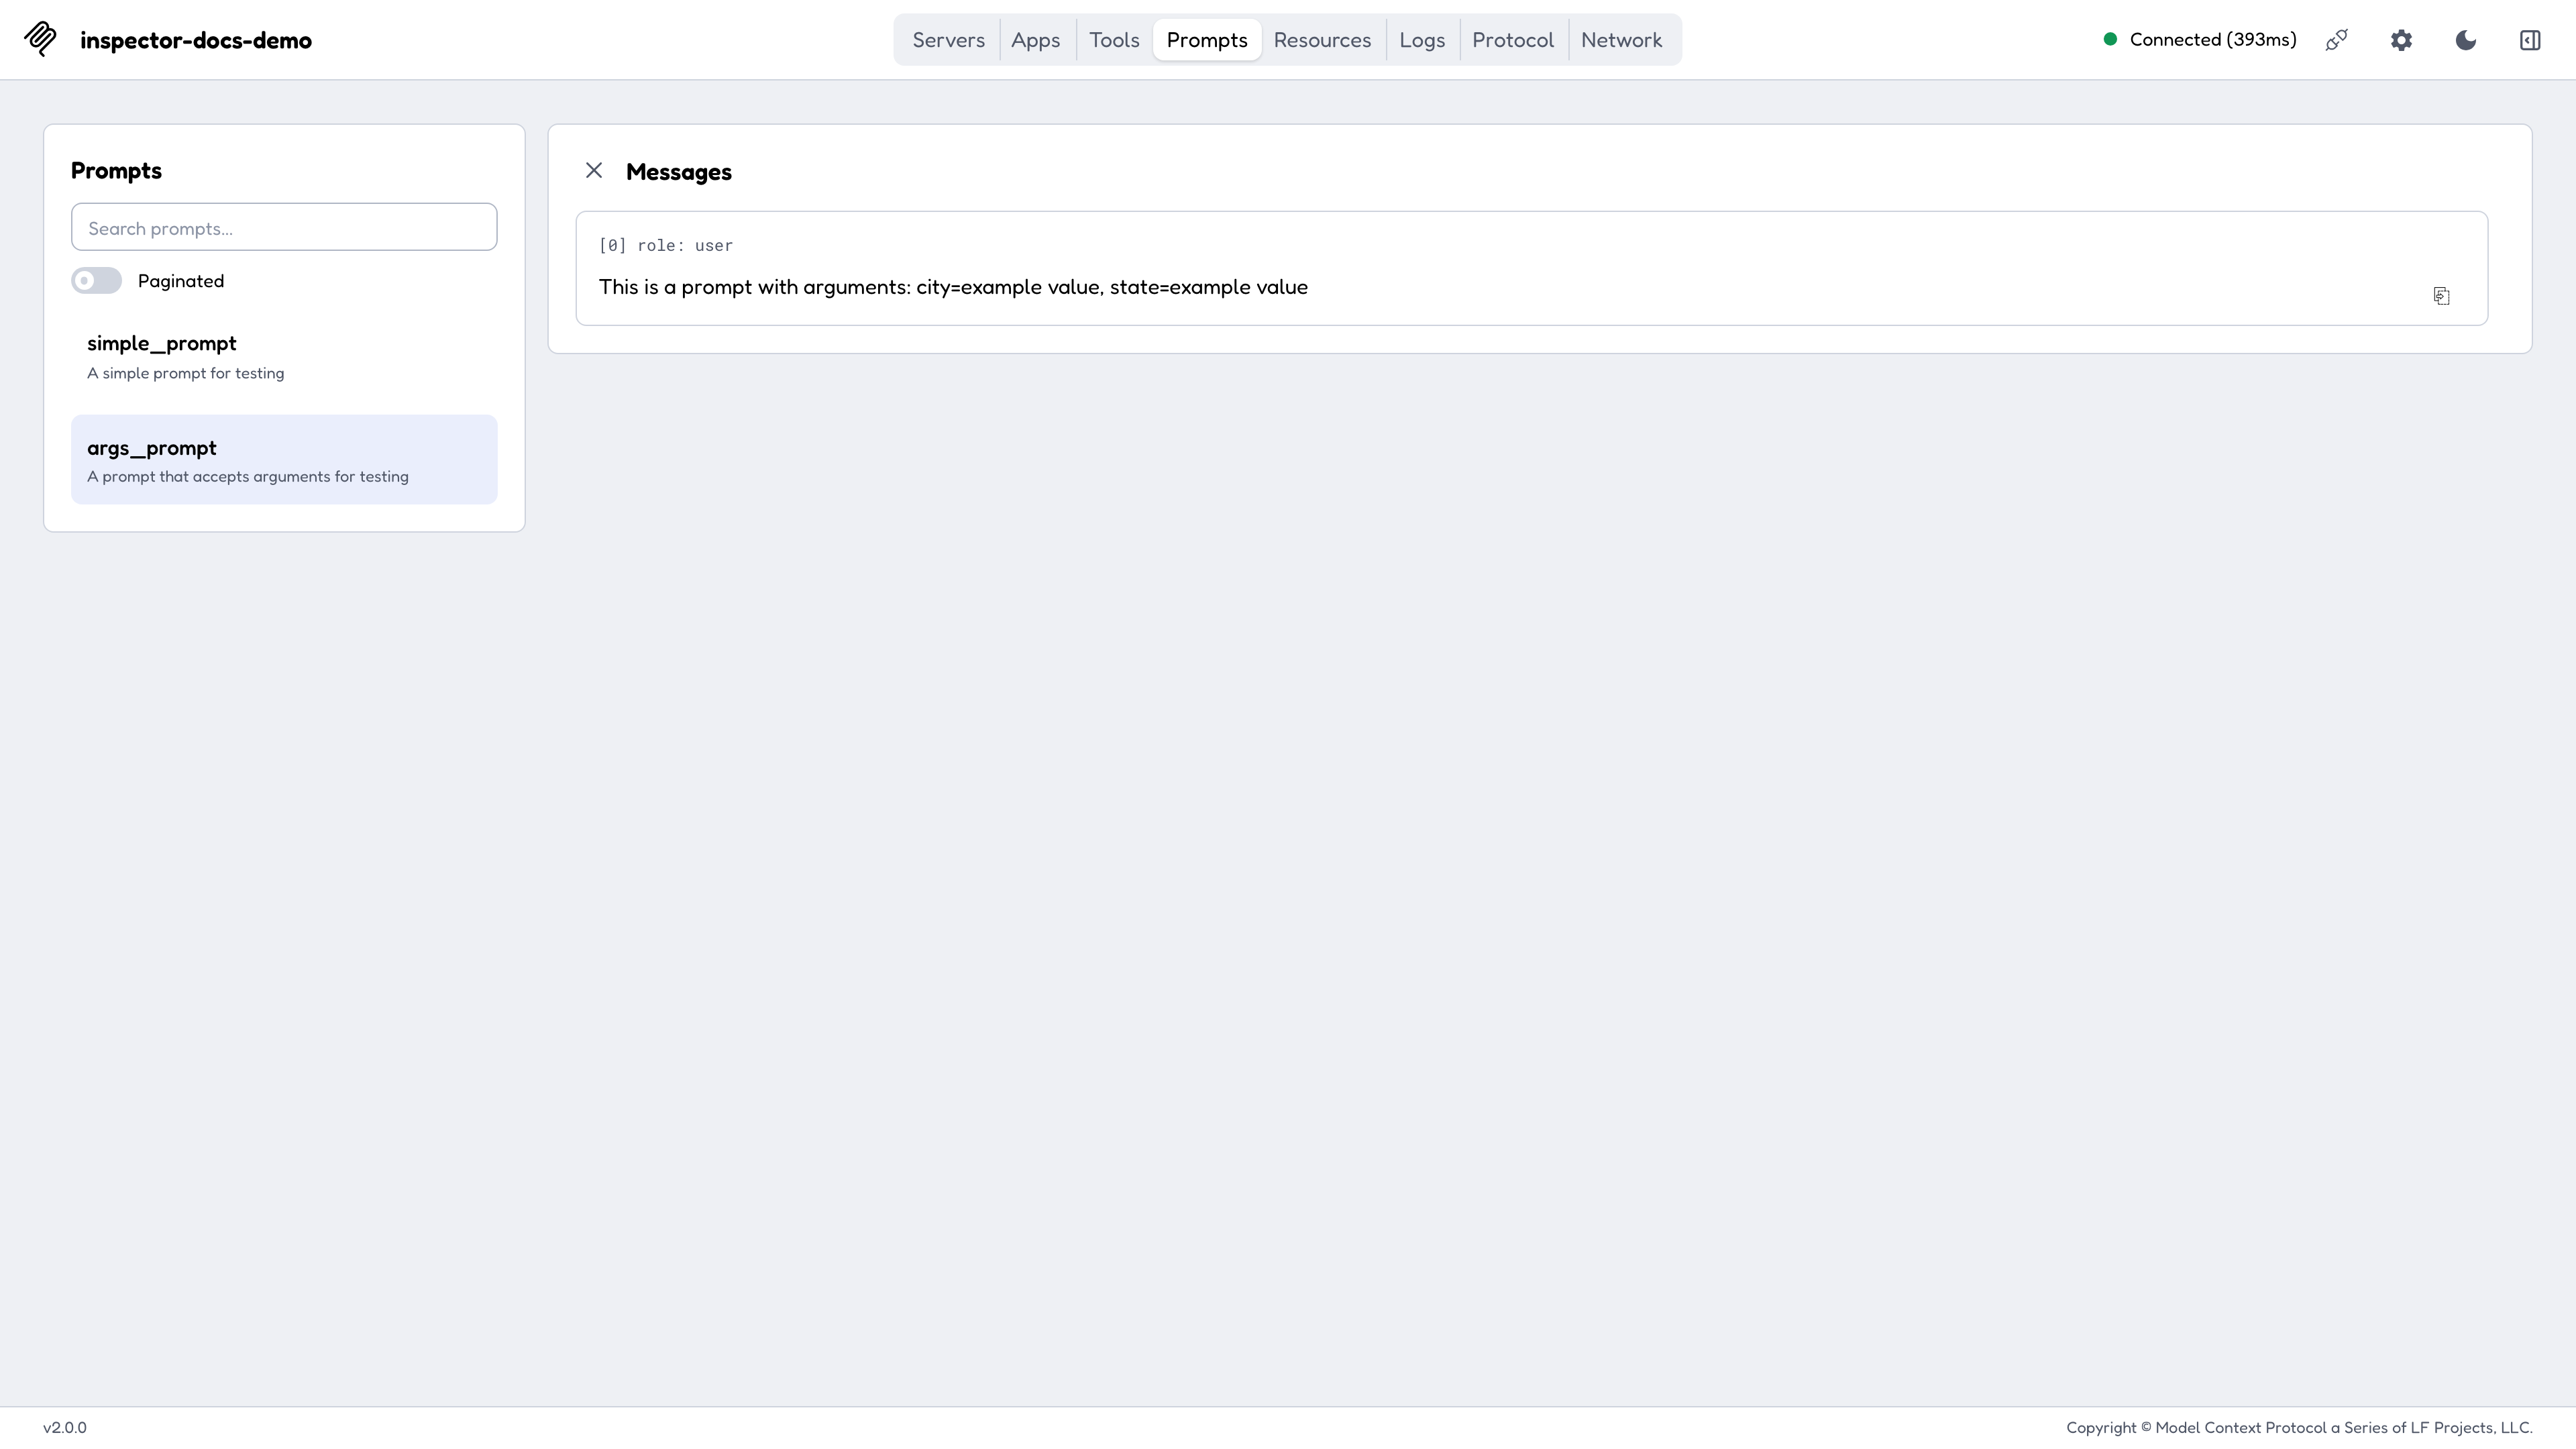
A prompt rendered with the arguments supplied.
Apps
MCP Apps are tools that carry UI. The Apps tab renders one in a sandboxed iframe served from a separate port, exercises theui/* bridge, and shows the view’s ui/message submissions and its notifications/message logs in panels below the frame.
- The sandbox listens on its own port,
6275by default (set it withMCP_SANDBOX_PORT). An app whose UI resource declares_meta.ui.domainhas its document served from a third listener, the app origin, on6278by default (MCP_APP_ORIGIN_PORT). Expose or forward both along with the web port. - The sandbox is gated by a
frame-ancestorsCSP, and a bracketed IPv6 literal is not a valid CSP host-source, so browse the Inspector atlocalhost,127.0.0.1, a hostname, or a LAN IPv4, not at a barehttp://[::1]:.... - By default the sandbox URL is plain
httpon the bind address, so anhttps://Inspector page blocks the frame as mixed content. Behind a TLS reverse proxy, setMCP_SANDBOX_FULL_ADDRESS(andMCP_APP_ORIGIN_FULL_ADDRESS) to the publichttps://address the browser reaches each listener at. Neither may share an origin with the Inspector UI; a value that does is ignored with a warning.
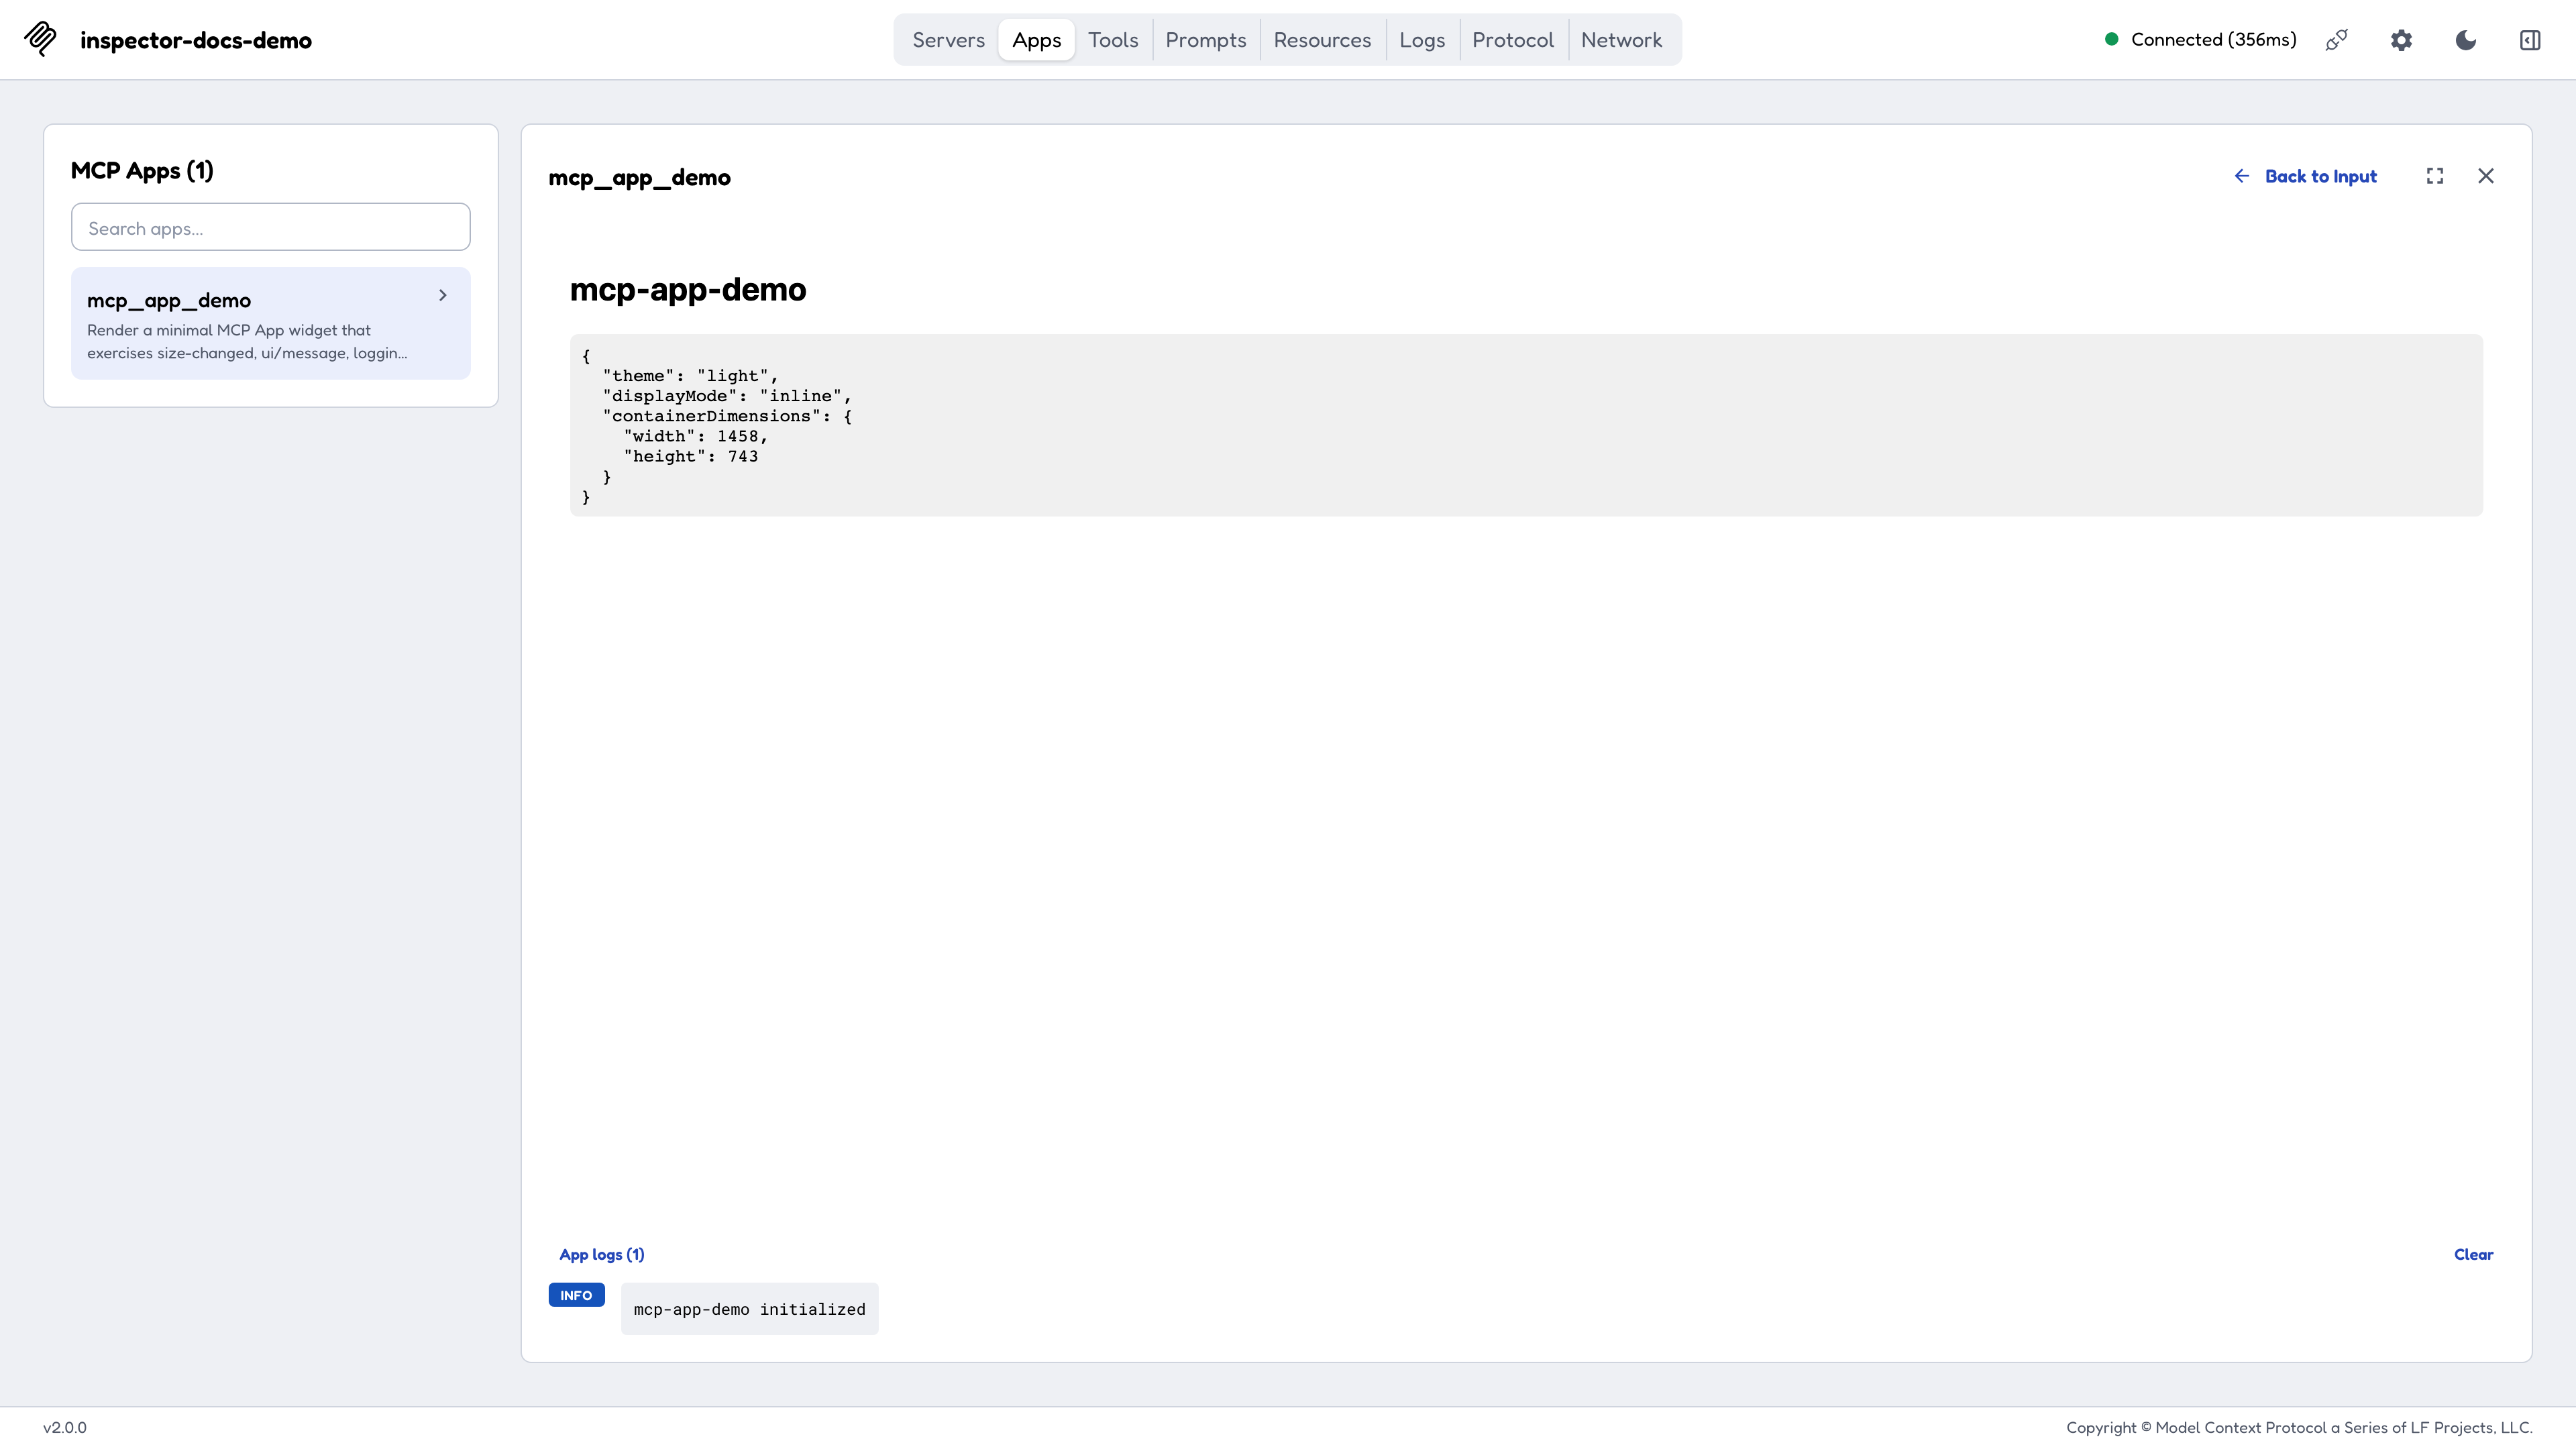
An MCP App rendered in its sandboxed frame, with the app's own logs below it.
Protocol, Network, and Console
The three tabs show the same traffic at different levels of detail:- Protocol: the JSON-RPC transcript. Requests paired with responses, notifications inline, MRTR rounds grouped as one conversation, and spec errors rendered by class.
- Network: the HTTP layer, for SSE and Streamable HTTP servers. Status codes, request and response headers, and bodies. On modern connections the standardized
Mcp-*headers are highlighted and sentinel values decoded. - Console: the connected stdio server process’s
stderr, which is where most stdio servers put their own diagnostics.
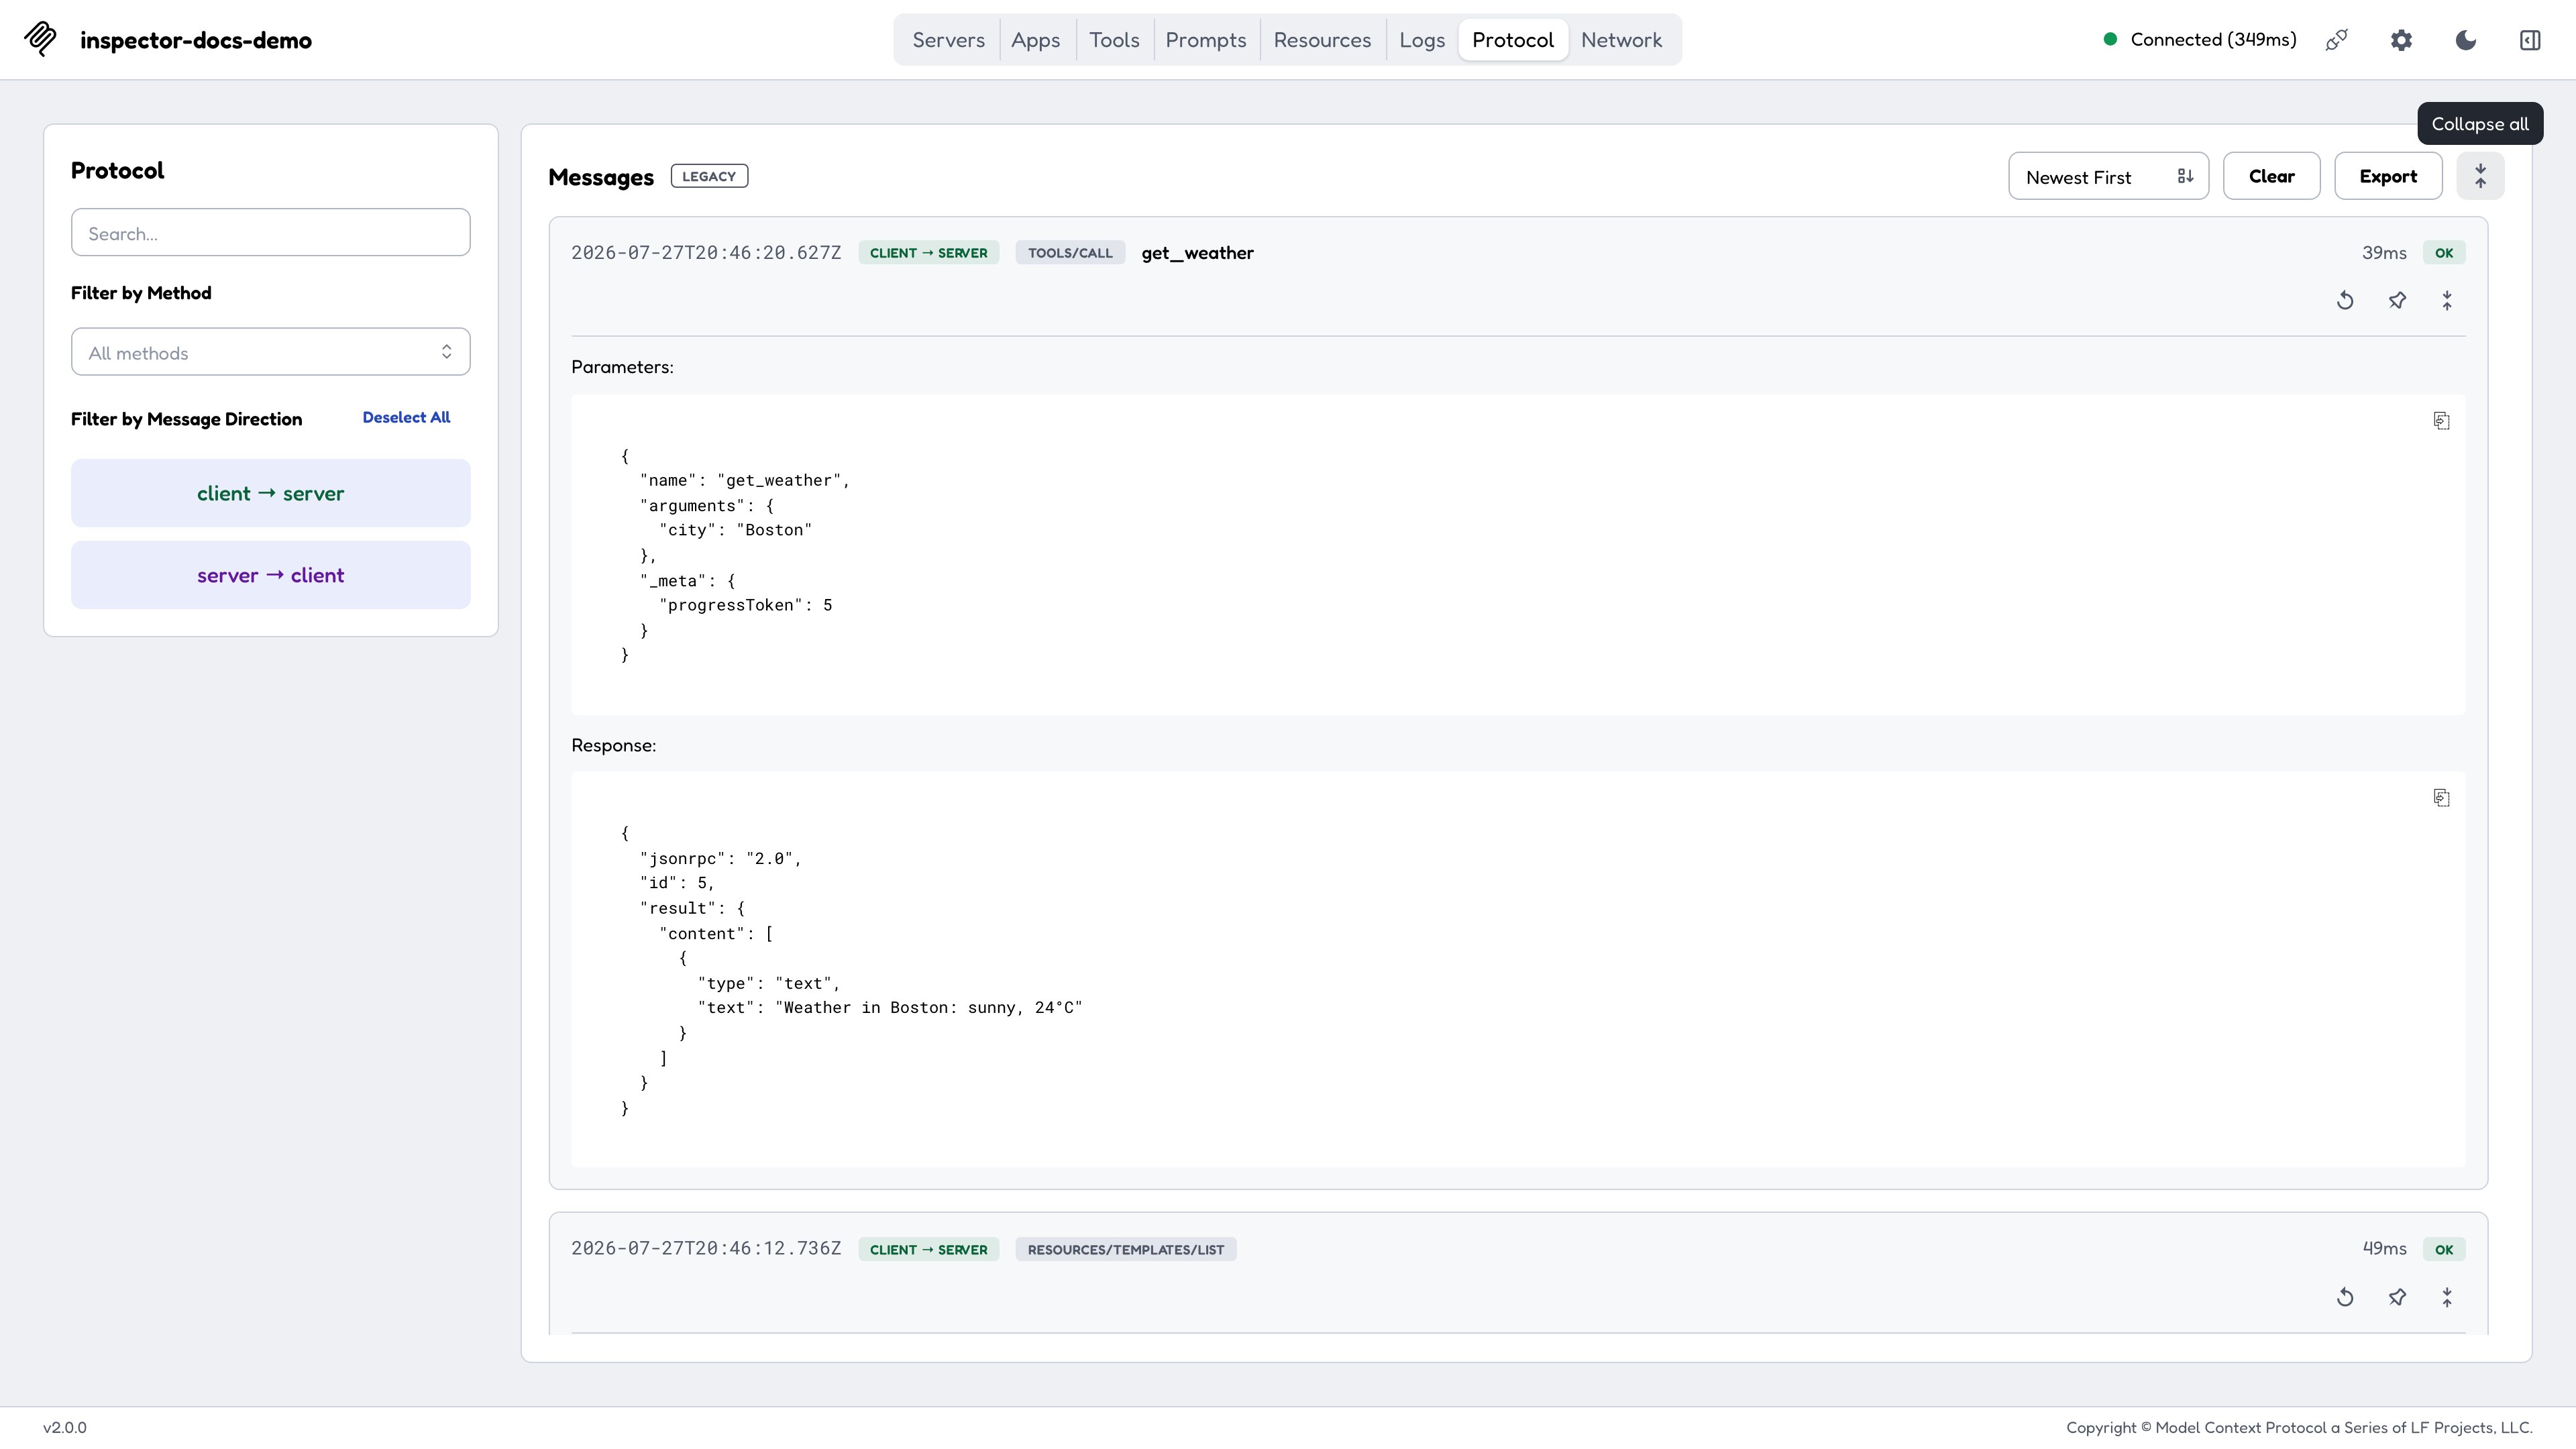
The Protocol tab with an entry expanded, showing the full JSON-RPC exchange.
Deep links
A driver (a script, a CI harness, or the CLI’s--print-handoff) can reach a connected Inspector with a single navigation:
openApp=<toolName> names the tool, appArgs=<base64url(JSON)> supplies its arguments (merged over the tool’s schema defaults), and autoOpen=<token> fires the tool call automatically. Because autoOpen fires a call, it carries the same mandatory token gate as autoConnect.
Host binding and origins
By default the Inspector binds127.0.0.1 and accepts requests only from the loopback origins for its port. Treat both defaults as security boundaries, since the backend spawns processes on your machine.
Binding all interfaces (HOST=0.0.0.0) is refused unless you set DANGEROUSLY_BIND_ALL_INTERFACES=true. Binding a specific non-loopback address is allowed with no opt-in, since that’s a single deliberate exposure rather than every interface at once.
See the Hosting on a network recipe for the full matrix, and Configuration for the variables.